
Graphical Abstract

1. Introduction
Beaver dam analogs (BDAs) are widely recognized as a viable approach to restoring degraded streams and enhancing beaver (Castor canadensis, Castor fiber) habitat across North America and Western Europe (Pollock et al. 2023). BDAs are permeable, low-head, temporary structures, built with natural materials and intended to mimic beaver dams and promote beaver activity (Wheaton et al. 2019; Pollock et al. 2023). As a type of process-based restoration (PBR) treatment, the implementation of BDAs aims to restore critical processes — hydraulic and geomorphic — to address impairments such as channel incision, floodplain disconnection, compromised vegetation recruitment, diminished hyporheic exchange, and thermal and sediment pollution (Beechie et al. 2010; Pollock et al. 2014; Bouwes et al. 2016; Weber et al. 2017; Ciotti et al. 2021). To the delight of many practitioners, beaver have recolonized some BDA projects and their dam-building activities at the project sites have further expanded the quantity and quality of ecosystem functions and services over time (Brazier et al. 2021; Larsen et al. 2021; Nash et al. 2021).
While hydraulic modeling can be applied to BDA designs for a variety of reasons, the lower technology (“low-tech”) intention of this PBR approach generally involves less prescriptive engineered design and heavy construction equipment, and more field-fit design and hand-building (Wheaton et al. 2019). Thoughtful site selection and the appropriate level of design analysis largely determine whether a BDA project will meet its objectives. As infrastructure and working lands increasingly intersect with potential BDA sites, practitioners often face conditions where deeper analysis is needed to anticipate hydraulic responses, evaluate risks, or support permitting. Hydraulic modeling can help practitioners explore likely system behavior — such as inundation extents, flood attenuation, habitat changes, flow paths, channel–floodplain connectivity, base‑flow behavior, and thermal effects — and can also assist in satisfying regulatory requirements. In such situations, a low‑tech design vision may need to be complemented with higher‑tech analytical tools.
Although more regionally specific guidance on site suitability is needed at the reach scale, some models offer hydrogeomorphic-based capacity estimates for riverscapes to support beaver at the landscape scale (Macfarlane et al. 2017; Dittbrenner et al. 2018; Graham et al. 2020). High rates of BDA implementation without careful consideration of site selection or long-term adaptive management may reduce their effectiveness and limit the restoration benefits they can provide (Bernhardt et al. 2005; Pilliod et al. 2018; Lautz et al. 2019; Nash et al. 2021; Wohl et al. 2024). In certain cases, a more thorough analysis of possible landscape trajectories for a BDA design under current and future conditions can identify unanticipated consequences like infrastructure impacts, flooding, sediment deposition, and flanking, especially in urban landscapes.
One example of this is a series of conservation efforts that led to a beaver resurgence in an urbanized stretch of Fanno Creek in Beaverton, Oregon, United States. By 2020, 5 beaver dams within a one-mile stretch accentuated seasonal flooding to overtop the highly trafficked Fanno Creek Bike Trail, leaving thick mud on the trail and many frustrated bikers and walkers once high water receded (BikePortland 2020).
Another example is a BDA project on Mill Creek in the Nancy Creek Watershed in Atlanta, Georgia, United States. In this highly urbanized watershed, BDAs aimed to accelerate streambank evolution through channel widening that promotes floodplain reconnection over time. After implementation, the creek flanked some structures, resulting in BDA mobilization, limited backwater effects, and less channel widening than anticipated (Smith 2025).
These examples highlight the need for practitioners to better anticipate how BDAs and subsequent beaver activity interact with local geomorphic and built environments.
To improve BDA implementation and better couple science with practice, practitioners have expressed demand for clear, practical guidance on recognizing when hydraulic modeling may offer value in the design process, indicating that the applied practitioner community supports the development of such guidance and would use tools that inform BDA design decisions. When modeling is necessary for a BDA design, modelers have also voiced the need for practical strategies to represent these dynamic and complex features within existing modeling platforms. No standard of practice exists for representing BDAs and beaver dams in hydraulic models, although techniques similar to approaches used to represent large wood are occasionally used in industry and research (Addy and Wilkinson 2019; Senior et al. 2022). These approaches include geometric adjustments, roughness adjustments, porosity, and inline structures. It is unknown how reasonable these approaches are in representing what is known about the complexity and dynamic nature of both the physical structure and range of flow states through a BDA or beaver dam (Ronnquist and Westbrook 2021; Muhawenimana et al. 2023; Aguirre et al. 2024). The equifinality and sensitivity to water surface elevations of these approaches is also unknown (Senior et al. 2022). Furthermore, with recent rises in BDA implementation and beaver repopulation efforts, state and federal legislations may require specific hydraulic and hydrologic conditions in designs and permitting (Corday 2022). For example, Colorado Senate Bill 270, passed in 2023, requires quantification of the water surface area increase per structure or treatment to assess the potential effect of evaporative losses on downstream water rights. As such policy evolves, practitioners increasingly need modeling evidence to support design and permitting decisions.
While the benefits and applications of beaver restoration are well-documented and highly desirable, a significant gap remains in understanding how to recognize when hydraulic modeling may benefit BDA design and how to reasonably represent beaver dams and BDAs in hydraulic models. To support practitioners navigating these design contexts, this research addresses 2 main objectives:
-
Develop a practical decision-support tool that helps practitioners identify situations where hydraulic modeling may benefit stream restoration projects proposing BDA features.
-
Provide practical guidance for incorporating BDAs into existing hydraulic models, including strategies and parameter adjustments to simulate how BDAs, and subsequent beaver activity, affect channel conditions over time.
Three case studies are used to illustrate the utility of the decision‑support tool and demonstrate the applicability of the modeling strategies evaluated.
2. Case Study Sites
This subject-area review includes 3 sites distributed across distinct geographic regions of the United States: Rough and Tumbling Creek, Colorado; Thompson Creek, Washington; and Towaliga River, Georgia (Figure 1).
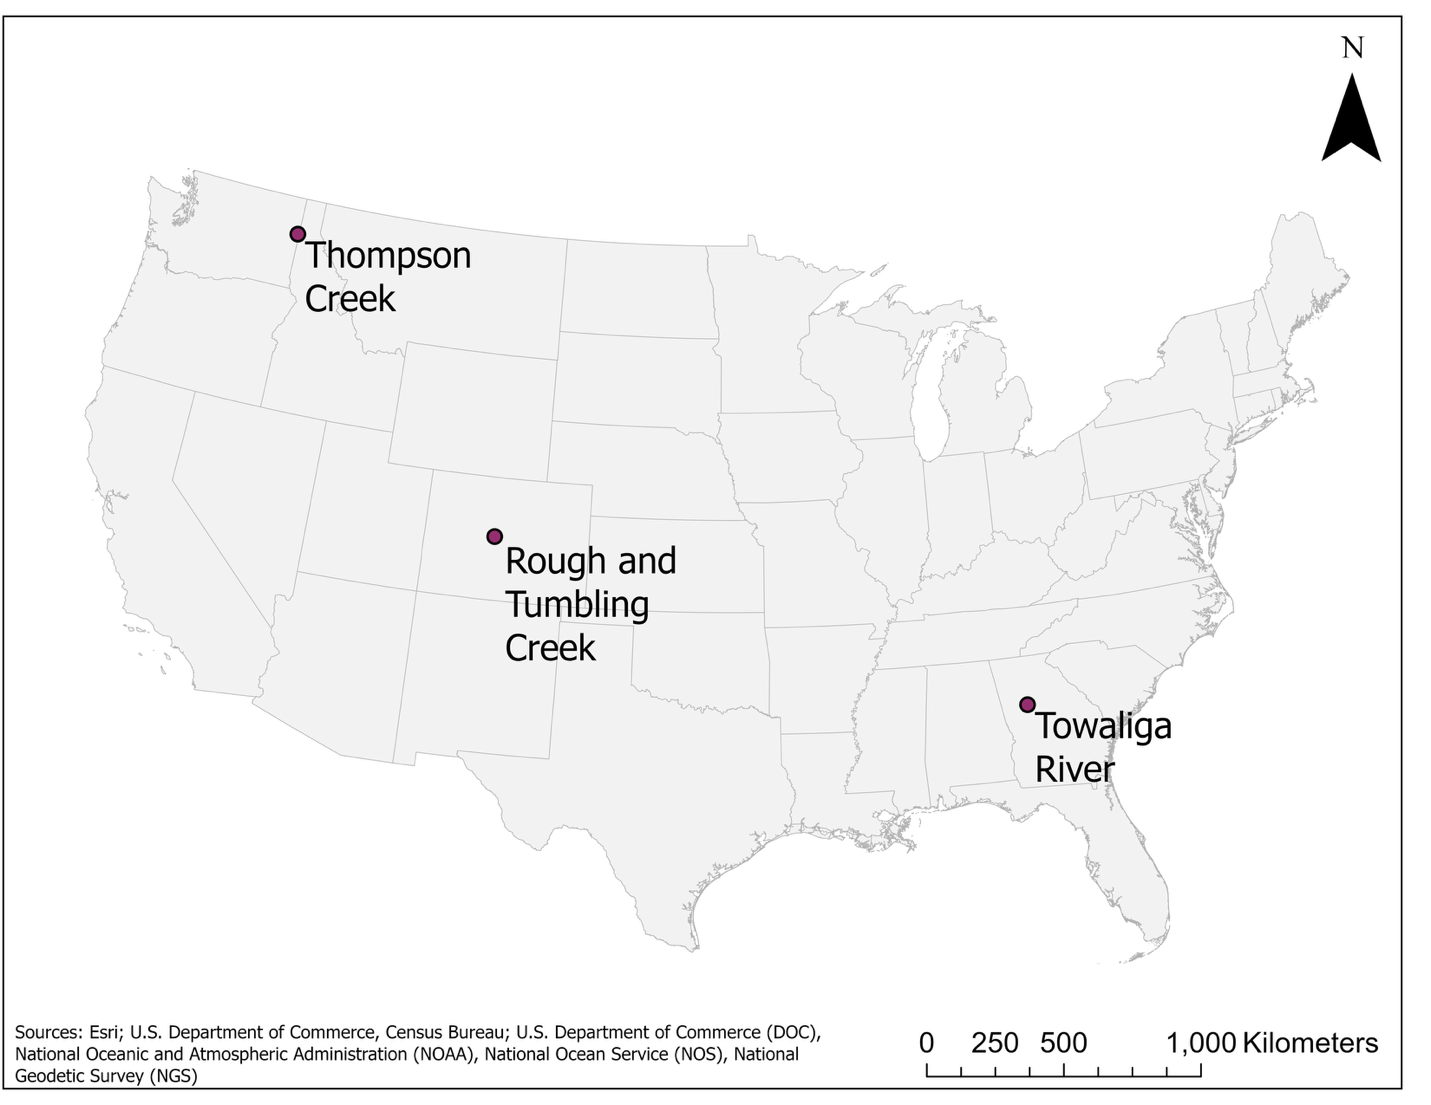
Fig. 1. Geographical locations of selected case study sites.
2.1. Rough and Tumbling Creek, Colorado, United States
In 2021, 36 structures (15 BDAs and 21 post-assisted log structures, or PALS) were installed on a 700-m stretch of Rough and Tumbling Creek (RnT), about 18 km southwest of Fairplay, Colorado (Figure 2). The project site lies 2.7 km upstream of the South Fork South Platte River confluence and drains 60.3 km2 of the Buffalo Peaks Wilderness. At an elevation of 2950 m, this subalpine headwater stream has low sediment input, a snowmelt peak around June, and low flow around October (M. Beardsley, Ecometrics, pers. communication 2025; U.S. Geological Survey 2019). Although the entire RnT valley historically supported beaver, a county-wide restoration assessment identified this reach as one where beaver absence is the primary stressor driving ecosystem degradation (Beardsley and Doran 2022). At the time of construction, active beaver dams were only 100 m upstream of the project site. Forest Service Road 158 crosses RnT at the upstream project boundary, separating the site from the nearest upstream beaver complex. The project reach shows 0.6 m – 1.2 m incision with an average bankfull width of 3 m. The project aimed to enhance habitat suitability for beavers, with the hope of beaver recolonization and persistence, through 2 types of low-tech restoration features: BDAs and PALS, designed to mimic beaver dams and wood jams, respectively (Beardsley and Doran 2022). Both types of structures were constructed with native materials, such as gravel, sod, conifer, aspen, and willows, sourced onsite. BDAs were built to about 0.3 m – 0.6 m (1 ft – 2 ft) tall, and most included vertical posts and woven willows for additional reinforcement and height. By winter of 2022, beavers reoccupied half of the project site, and by 2024, beavers continued to spread throughout the project site, building onto 11 of the original BDAs, and constructing at least 14 new dams (Project Photo 1, Project Photo 2). As of May 2025, field observations confirmed that beaver continue to modify the site, inundating nearly the entire valley floor and creating a mosaic of diverse habitats supporting a range of wildlife.
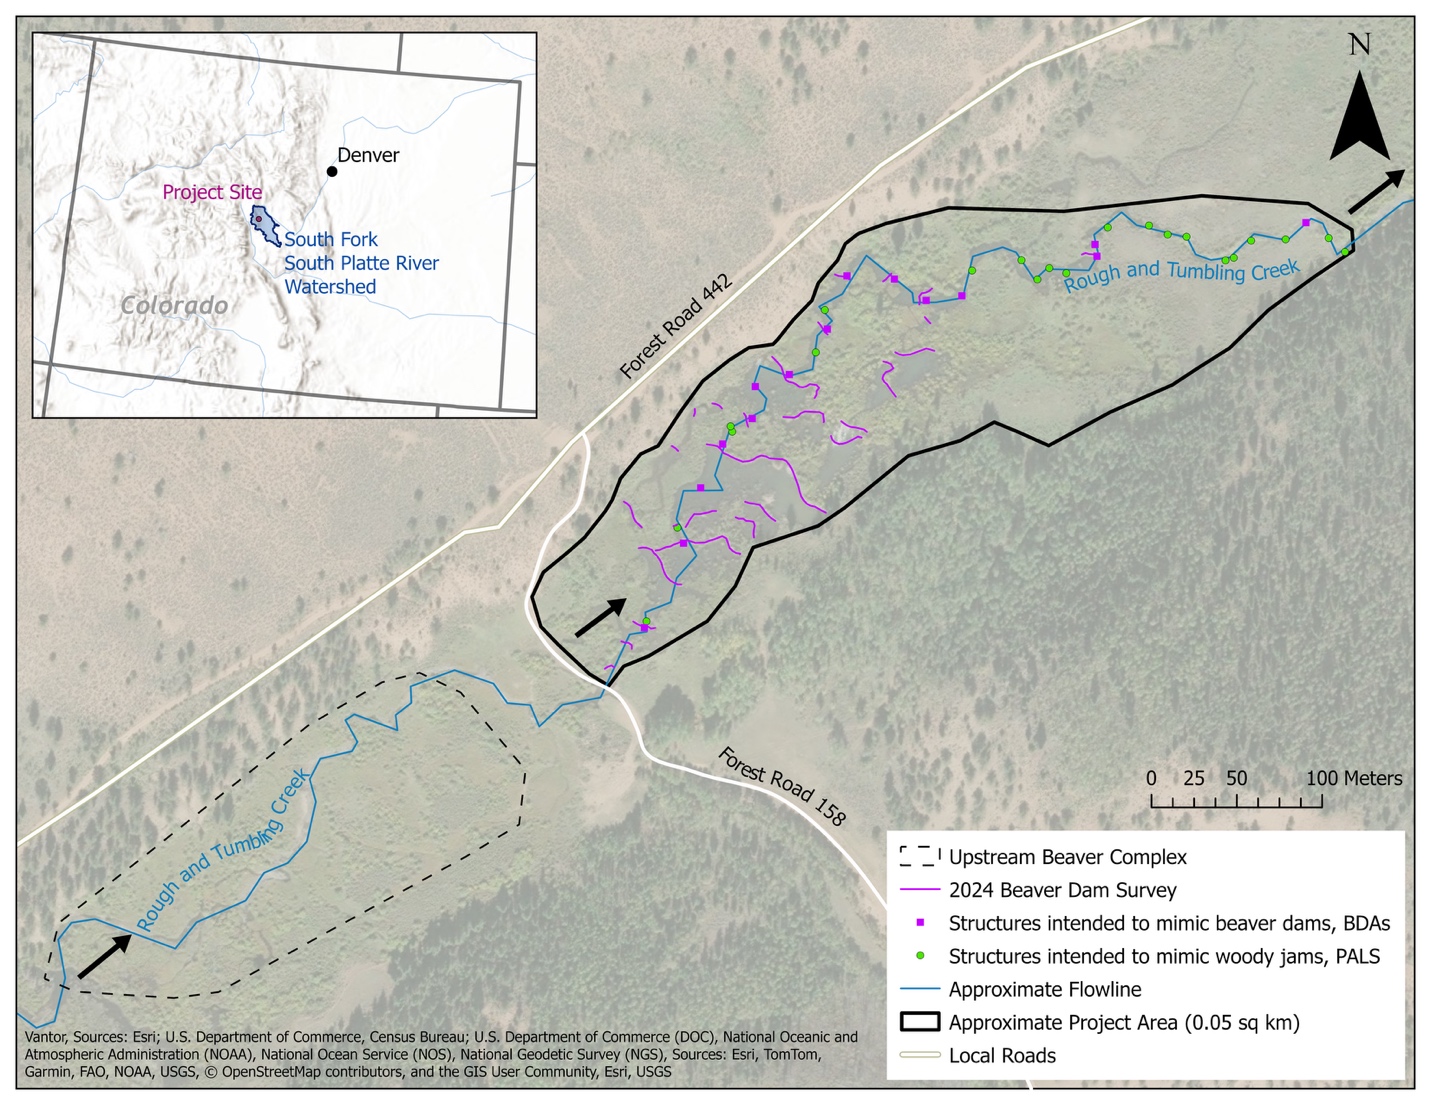
Fig. 2. Site map of 2021 Rough and Tumbling Creek BDA project showing as-built locations of 36 restoration features, including a mixture of beaver dam analogs and post-assisted log structures. Black arrows indicate flow direction from southeast to north-northeast.
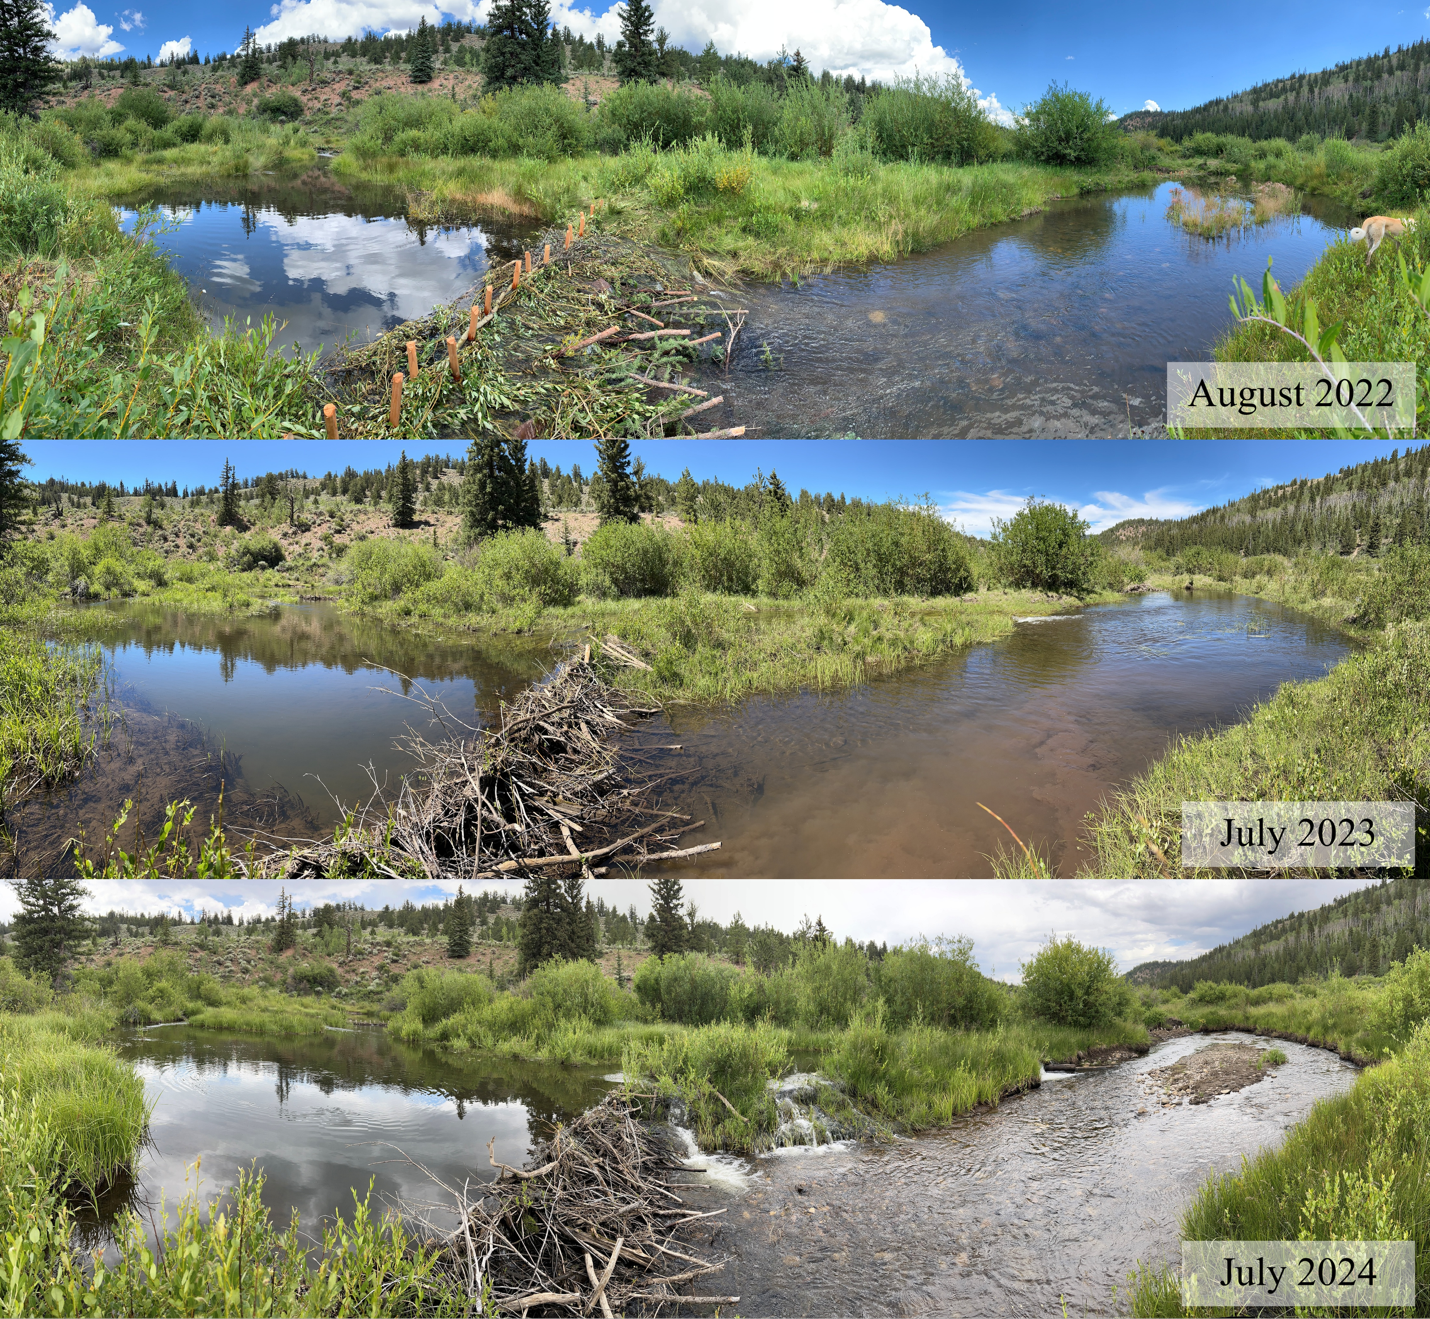
Project Photo 1 Rough and Tumbling Creek photo point showing a 3-year beaver dam analog (BDA) evolution as beaver recolonize the project reach. Images courtesy of EcoMetrics.
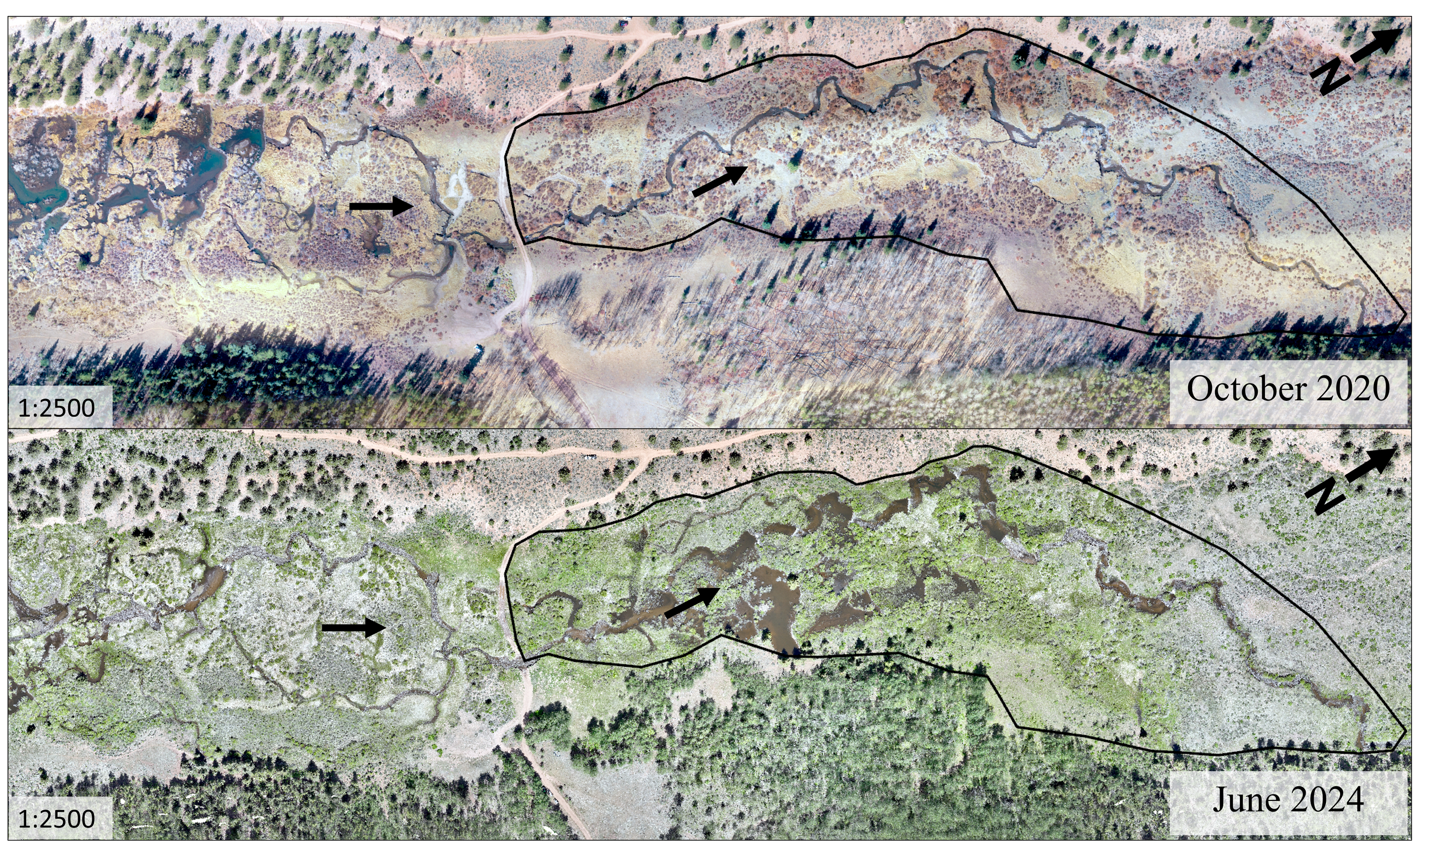
Project Photo 2 Aerial imagery of the Rough and Tumbling Creek project site (stream flow going left to right, North arrow at upper right) showing October 2020 conditions before the BDA project with an active upstream beaver complex, compared to June 2024 conditions (3 years after project implementation) with extensive beaver recolonization throughout the project reach and some abandonment and breaching of dams in the upstream beaver complex. Images courtesy of EcoMetrics.
2.2. Thompson Creek, Washington, United States
Thompson Creek (TC), the second BDA site, is a primary tributary and the only surface water connection to Newman Lake in Spokane County, Washington. (Figure S1). The project site drains an area of 31.3 km2 and the watershed has ongoing logging operations, off-road vehicle use, and agricultural practices that contribute a significant amount of sediment and total phosphorus (TP) into TC (Whiley & Merrill 2007). The downstream-most reach of TC was straightened and dredged for agricultural purposes, resulting in 1.2 m – 1.5 m of incision throughout the project reach and less connection to the wide flat floodplain. This incision and floodplain disconnection accelerates the transportation of sediment and TP from the watershed into Newman Lake. Washington Department of Ecology (DOE) repeatedly lists Newman Lake on the Total Maximum Daily Load 303d lists for total phosphorus, most recently in the 2018 Water Quality Assessment. As a result, project objectives were to decrease TP loading contributions from TC through floodplain reconnection, riparian vegetation enhancement, and increased wood roughness to reduce velocities. No active beaver signs were found during site assessment.
The TC BDA design required limited permitting because Newman Lake does not have a direct surface water connection to Spokane River, per the Clean Water Act. However, the project did have to consider the Spokane County Flood Damage Protection Ordinance (SCFDPO), which indicated that the base flood elevation must be maintained within Thompson Creek and not impact the upstream bridge and fire station infrastructure. A one-dimensional (1D) hydraulic model was used to finalize the design location and characteristics (e.g., structure type and height) of the BDA structures to ensure minimal flooding impacts to this upstream infrastructure and to address any concerns as part of the SCFDPO permitting process. The resulting design included 18 structures (9 BDA-modified structures, and 9 non-ponding roughness features, intended to increase channel roughness and slow velocities). In 2021, these structures were installed along the reach between the bridge at Newman Lake Road and Newman Lake (Figure S2). Future phases of this project anticipate construction of floodplain BDAs adjacent to the 2021 project, adaptive management of the existing structures, and the potential for BDAs to be placed upstream of the bridge at Newman Lake Road.
2.3. Towaliga River, Georgia, United States
The third BDA project, in design phase as of June 2025, occupies a headwater reach of the Towaliga River in Henry County, Georgia, just northwest of Hampton (Figure S3). The site has a drainage area of just 5.7 km2 and lies within predominately open pastureland, immediately downstream of a major paved county road (Wynn Drive). A 14.3-m (47-ft) culvert crossing under Wynn Drive traps sediment and wood at its upstream inlet and measures 0.9 m of channel incision at its downstream outlet.
BDAs are proposed downstream of the culvert crossing, where the existing channel bottom is incised 1.4 m – 1.8 m below the historic floodplain (Figure S4). Field assessments indicated an active beaver complex just upstream of the project site. One beaver dam is 12 m upstream of the Wynn Drive culverts, while a series of 5 additional dams begin 94 m downstream of the culverts. The dams range from 0.6 – 0.9 m (2 ft –3 ft) high, measured from the upstream channel bottom, and are comprised mostly of logs, sticks and packed mud (Figure S5). The current design proposes BDAs just downstream of the last existing beaver dam, located 271 m downstream of the culverts. This project serves as a 0.2-km2 compensatory mitigation site to satisfy wetland credits with the Georgia-Alabama Land Trust. Project objectives target full mitigation credit, requiring water levels within 25.4 cm (10 in) of the ground surface for 27 consecutive days during the growing season, and prioritizing select tree species (e.g., Quercus spp.) for long-term monitoring.
3. Methods
3.1. Decision-Support Tool for BDA Modeling
Practitioners use hydraulic modeling to explore a variety of ecosystem functions and services associated with BDAs; however, modeling requires data, time, resources, and technical expertise, and many BDA projects do not require hydraulic modeling to achieve their goals. Several frameworks exist for evaluating hazards associated with large wood in streams (Wohl et al. 2016) and for guiding management of beaver recolonization (Wohl et al. 2019; City of Portland Environmental Services 2024; Kinas et al. 2024), yet no framework currently supports practitioners in recognizing when hydraulic modeling may add value to BDA design. Accordingly, development of the decision‑support tool centered on identifying the common ways modeling can inform BDA projects and on iteratively refining the tool through literature review, stakeholder engagement, and design analysis (Figure S6).
Hydraulic modeling can help practitioners understand both the potential risks and potential benefits of a proposed BDA design. Potential risks that modeling can illuminate include maximum backwater extents, soil saturation thresholds, changes in groundwater and storage dynamics, dam mobilization or breaching, and upstream channel widening or aggradation (Pollock et al. 2014; Bouwes et al. 2016; Nash et al. 2018; Neumayer et al. 2020; Scamardo and Wohl 2020; Bobst et al. 2022). Potential benefits that modeling can identify include changes in hydraulic variability, attenuation of peak flows, improvements in water quality or thermal buffering, and a suite of ecological benefits (Pollock et al. 2014; Majerova et al. 2015; Bouwes et al. 2016; Weber et al. 2017; Neumayer et al. 2020). Stakeholders interpret project outcomes differently depending on their goals and the project’s response, so the assessment of risks and benefits must be grounded in both project context and foundational BDA design principles. This evaluation process helped identify situations where hydraulic modeling may serve as an appropriate and useful tool to support BDA design decisions (Table 1).
Table 1 Situations in which hydraulic modeling may be applied to a BDA project, based on literature review and stakeholder engagement (not exhaustive)
| Situations | Potential Criteria | Metrics |
| Managing risks | Maximum ponded extent | Distance to upstream concern |
| Dam mobilization or breach | Distance to downstream concern | |
|
Design intent for BDA stability (Wheaton et al. 2019; Pollock et al. 2023) |
Structural stability, channel evolution stage (Cluer and Thorne, 2014) | |
| Required reporting | Project objectives | Yes/No |
| Permitting | ||
| Monitoring | ||
| Anticipatory modeling | Beaver colonization likelihood | Recolonization/translocation potential |
| Headcut migration upstream | Yes/No | |
| Sediment or wood delivery | Yes/No | |
| Design refinement | Design of each structure | Yes/No |
| Placement, spacing within site | ||
| Landscape restoration gaps (Beaver Institute 2025) | ||
| Living with beaver | Flow adjustment device (Lisle 2003) | Yes/No |
| Future site suitability |
Anticipated hydrology Sediment and/or wood supply to site |
Yes/No |
We performed a literature review on the design intent of BDAs and the current state of hydraulic modeling relevant to BDAs, natural beaver dams, and large wood structures, recognizing that few BDA‑specific modeling studies currently exist. Next, we engaged stakeholders selected for their experience in BDA research, design, restoration practice, permitting, land stewardship, or their connection to BDA projects through professional networks or private landownership. The final stakeholder group included 41 individuals representing 26 affiliations (i.e., universities, non-profits, federal or state agencies, consulting firms, and private landowners) spanning multiple regions and offering a wide range of perspectives in beaver restoration, BDA design, and hydraulic modeling. We corresponded with stakeholders through informal interviews, email exchanges, site visits, internship collaborations, technical support discussions, and phone calls. Feedback from these engagements, combined with insights from the literature review, helped refine the key themes that indicate situations where hydraulic modeling may be useful for supporting BDA design (Table 1). These themes informed the development of a conceptual model in the form of a decision‑support tool.
Expert judgment, through technical review sessions and additional conversations with both repeat and new stakeholders, guided multiple iterations of analysis and refinement of the decision-support tool. The overall development process intentionally incorporated a broad range of perspectives and potential considerations in early stages, increasing the tool’s complexity, followed by successive rounds focused on simplifying and clarifying the tool so it will provide practical cues rather than rigid criteria. As the first decision-support tool of its kind, we emphasize that both the selection and value judgment of the criteria in this tool represent a starting point for context-specific decision-making intrinsic to each project. The intended use of this tool is for rapid decision-making by restoration designers and project proponents when determining whether hydraulic modeling may benefit a proposed BDA project. This tool may be especially useful as a decision-support resource for less-experienced practitioners, to be used in conjunction with oversight from experienced professionals or for projects in higher-risk settings, such as urban or agricultural areas.
3.2. Hydraulic Modeling of BDAs
The hydraulic modeling effort aimed to develop initial modeling guidance for how to reasonably represent BDAs in a hydraulic model, including scenarios in which beaver recolonize a BDA site. Therefore, we tested various model features to represent BDAs, evaluated how each approach performed, and presented initial modeling guidance based on insights gained through the modeling exercise.
3.2.1. Site Selection
The Rough and Tumbling (RnT) Creek site features a robust pre- and post-project monitoring dataset and demonstrated rapid landscape evolution following beaver recolonization. Insights from the RnT hydraulic modeling informed recommendations for the Thompson Creek and Towaliga River BDA projects. Following BDA project implementation in 2021 (Section 2.1), beavers recolonized the site during winter of that year, likely migrating from upstream, as indicated by several degraded and breached dams in the upstream beaver complex. By the summer of 2023, beavers expanded dam building throughout the project site by extending existing BDAs into the floodplain and constructing new dams across the valley floor.
Previous modeling efforts have explored beaver occupancy upstream or downstream of project sites through giving equal attention to reaches with and without beaver to compare the resulting hydraulic and hydrologic effects (Majerova et al. 2015; Stout et al. 2017). In this case study, we included the upstream beaver complex at the RnT site in the modeling domain to account for its impact on downstream hydraulics within the project site, but we did not make it the primary focus. Preliminary modeling of pre-project conditions indicated that breaklines derived from unedited LiDAR terrain across dams in the upstream beaver complex provided sufficient geometric details for hydraulic simulations of downstream flow in the 2021 project reach, as confirmed by observed inundation extents from surveys and aerial imagery. The modeling effort primarily focused on the evolution of the reach with BDAs, referred to as the project site.
3.2.2. Data Collection
A comprehensive dataset for the RnT project, spanning from 2017 to 2024, includes repeat 1-inch resolution orthophoto mosaics and digital surface models (DSMs) from biannual or annual drone flights beginning in 2020, hourly water level data from loggers installed in 2021, photo points from 2021 onwards, GPS surveys of surface water extents and beaver dam extents (2017, 2020 – 2024), and 5 valley-spanning GPS transects from a site survey on 18 June 2024. We selected 18 June 2024 as the reference date for modeling restored conditions (3 years post-project implementation) based on the availability of high-resolution aerial imagery and supporting field data. The 2024 GPS survey of beaver dam structures, including both evolving as-built BDAs (constructed in 2021 and subsequently modified by beavers) and new beaver dams created since BDA project implementation, was used to determine which structures to represent in the restored conditions models.
We obtained the most recent LiDAR dataset for the site, acquired between 2018 and 2019, as a 1 m-resolution digital elevation model (DEM) from the Colorado Water Conservation Board (CWCB), and the U.S. Geological Survey’s 2020 National Land Cover Database (NLCD) at 30-m resolution from the Multi-Resolution Land Characteristics Consortium (MRLC) viewer. Although the 2019 LiDAR does not capture bathymetry, we retained the unedited terrain because survey data for the full complex were unavailable and water depths appeared shallow enough for the LiDAR surface to reasonably represent channel topography. Additionally, 2020 land cover did not fully capture habitat complexity across the valley floor, particularly the patchiness of emergent and woody wetlands. We manually edited the valley floor within the model domain based on aerial imagery, photo prints, and site visit validation.
After refinement of the NLDC dataset within the project area, we assigned roughness values to the land cover zones (Table 2) based off published values (Yochum et al. 2014) and aerial imagery. We verified these values during field observations in May 2025.
Table 2 Summary of roughness values (Manning’s n) used in the hydraulic model. Values are based on HEC-RAS guidance (Brunner 2025a) and field verified.
| Land Cover | Manning’s n |
| Shrub-Scrub | 0.14 |
| Emergent Herbaceous Wetlands | 0.095 |
| Woody Wetlands | 0.11 |
| Evergreen Forest | 0.15 |
| Deciduous Forest | 0.15 |
| Developed – Open Space | 0.035 |
| Developed – Low Intensity | 0.04 |
| Mixed Forest | 0.14 |
| Grassland-Herbaceous | 0.04 |
| Channel | 0.06 |
3.2.3. Hydrology
RnT is an ungaged system; therefore, we selected the South Fork South Platte (SF South Platte, Gage SFKANTCO05) gage near Antero as the most suitable reference for scaling RnT hydrology due to similar geology, precipitation, and overland flow characteristics. This gage is located approximately 11 km downstream of the project site and 140 m lower in elevation. Although the gage on SF South Platte lies in an unconfined valley with disconnected hillslopes (South Park), compared to the project site’s confined valley with connected hillslopes, it represents the best available data source. This choice was further supported by project designers familiar with both systems. RnT joins SF South Platte approximately 2.5 km downstream of the project site.
In June, flow in high-elevation subalpine streams in the Rocky Mountains is generally snowmelt-dominated and transitioning towards baseflow. We scaled the recorded 24-hr hydrograph at 15-min intervals for 18 June 2024 by drainage area (Equation 1), assuming a coefficient of c = 1 to reflect near-linear scaling of discharge with drainage area under spatially distributed snowmelt conditions to approximate a hydrograph for modeling restored conditions at RnT (Table 3). Using this scaled hydrograph, we created an artificial 4-hr hydrograph for the project site, with flow ramping linearly from 0 cms to the calculated peak discharge over the first hour (i.e., a 1-hr step up). This ramp-up approach is recommended in unsteady 2D HEC-RAS modeling to allow the model to reach stable numerical solutions at the upstream boundary when starting from no flow, particularly in systems where flow builds quickly from low base or starting conditions (Brunner 2025a).

Equation 1 shows the relationship between drainage area, A, and discharge, Q.
Table 3 Proposed flow conditions for project site, scaled to downstream gage
| Drainage Area | Peak Q (cms) | |
| Gage | km2 | 2024 Restored Conditions |
| SFKANTCO05 | 226.1 | 4.53 |
| RnT Project Site | 60.3 | 1.21* |
Historical climate records from the National Centers for Environmental Information (NCEI) monitoring station USS0006K43S indicate 0.25 cm (0.1 in) of precipitation on 18 June 2024, with no precipitation recorded during the preceding week. These observations suggest that flows at the project site on the reference date were likely not significantly influenced by recent rainfall, and that the project site could be reasonably scaled by the selected downstream gage without additional adjustment for baseflow differences between the 2 drainage areas. The most recent plausible rain-on-snow event likely occurred on 9 June 9 2024, when the station recorded over 3 cm (1.2 in) of precipitation, potentially contributing to elevated base flows earlier in the month prior to the reference date. Given these conditions, discharge data from the SF South Platte gage provided a suitable reference for scaling RnT stream hydrology in this modeling effort, especially since the primary goal of this case study is to build hydraulic modeling guidance rather than to replicate exact site conditions. This scaling approach should be considered during model evaluation, given the substantial uncertainties associated with unmeasured stream flows at the project site.
3.2.4. Model Development
We developed a 2-dimensional (2D) unsteady hydraulic model for RnT using the U.S. Army Corps of Engineers Hydrologic Engineering Center’s River Analysis System (HEC-RAS) version 6.6 (2024). HEC-RAS 2D uses a finite-volume computational mesh to represent the terrain. The model built for restored conditions included 25 dams all within the project area, 11 of which were beaver-modified BDAs.
Restored conditions feature structural complexity and variability in each beaver dam and BDA throughout the model domain, but to isolate the effects of different modeling approaches, we chose to test one model representation at a time. For example, to test inline weirs, we applied inline weirs as a uniform approach to represent all dams. This simplification enabled direct comparison between modeling approaches while acknowledging dam complexity is not fully represented throughout the model domain.
We delineated the model domain extent laterally by tracing mountain ridgelines and longitudinally extended upstream and downstream to minimize boundary effects, situating domain limits to avoid influences from beaver complexes or any tributary junctions that could impact boundary conditions. We set the nominal grid resolution to 100 ft x 100 ft, with a rectangular refinement region (20 ft x 20 ft) spanning the valley floor to encompass the upstream beaver complex and project site. We refined the mesh further using breaklines and mesh editing tools, depending on the needs of each approach used to represent BDAs.
Boundary conditions included inlet discharge flow hydrograph (see Hydrology) and outlet normal depth slope. We set the downstream boundary condition friction slope to 0.0128 ft/ft. This reasonably represented the valley gradient across the entire model domain, as well as beyond the downstream boundary, despite localized patchy and dynamic variability due to beaver activity throughout the entire RnT valley.
We conducted a series of preliminary simulations to inform selection of key computational parameters, including mesh size, computational time step, and equations for solving 2D unsteady flow routing. Preliminary simulations began with coarser mesh sizes (50 ft) along the thalweg breakline outside of the 20-ft refinement region and iteratively incorporated finer detail, down to 5-ft cell sizes, to evaluate changes in water surface elevation (WSE). This test produced limited differences in WSE, especially with the incorporation of the refinement region. Ultimately, we determined mesh size around the BDAs and dams based on the approach tested, since some approaches required finer cell sizes to capture smaller-scale terrain modifications. Generally, this worked out to breaklines at BDAs set to 10 ft for approaches using roughness adjustments or inline weirs; 5 ft for geometry adjustments, porosity, or combined inline weirs and geometry adjustments; and 1.5 ft for vertical posts. We also varied the computational time step during initial simulations, guided by the Courant condition, based on the Courant-Friedrichs-Lewy (CFL) condition (Equation 2):

where C is Courant number, V is the wave speed (ft/s), t is the time step, and x is the distance step (cell size). For the Diffusion-Wave Equations (DWE), C ≤2 (maximum C = 5 ), and for Shallow Water Equations (SWE), C ≤1 (maximum C = 3).
We initially varied the time step based on using the DWE equation set. After multiple iterations, and as model complexity increased, we selected a time step of 1 s as optimal for all simulations, satisfying velocities generally ranging from 0 ft/s to 4 ft/s across grid sizes ranging from 1 sq ft to 10 sq ft along the thalweg and 20 sq ft in the refinement region. Upon analysis of output hydrographs of the same simulations solved with both DWE and SWE, we observed that both approaches produced approximately the same results for site-scale inundation extents and WSE, similar to those of other studies (Sabeti et al. 2024). Some approaches became unstable with the SWE (e.g., geometry adjustment, vertical posts), and others had substantial increases in computation times across the different approaches to represent BDAs. SWE provide more accurate 2D results through better capturing of 2D flow paths (in particular, turbulence and eddies) and localized velocities around the BDAs. Therefore, we used SWE (Eulerian-Lagrangian Method) for all simulations, through shortening time steps (0.3 s – 1 s) as necessary to achieve appropriate Courant conditions (C ≤2, with 8 of 9 approaches C ≤1) and satisfactory maximum cell WSE errors between 0.003 ft – 0.02 ft.
3.2.5. Model Runs
After a comprehensive literature review and engagement with practitioners, we selected 9 approaches for representing BDAs to test: 1) do nothing, 2) geometry adjustments, 3) inline weirs, 4) roughness adjustments, 5) vertical posts, 6) porosity, 7) geometry adjustments with roughness adjustments, 8) geometry adjustments with roughness adjustments plus inline weirs at level grade, and 9) vertical posts with roughness adjustments (Table 4). Overall, approaches 2, 3, and 4 tested representations already common in literature and practice; approaches 5 and 6 tested more novel, less commonly used representations; and approaches 7, 8, and 9 tested various combinations of approaches 2, 3, and 4. There are many more combinations and approaches to represent BDAs (e.g., inline weir with culverts), but these approaches served as good starting points to address the second objective. Motivations for why these particular approaches were selected are described below:
-
Approach 1 provided a baseline for the implications of not representing BDAs.
-
Approaches 2 and 3 tested the efficacy of treating BDAs as impermeable low-head dams: berms burned into the terrain (approach 2) and uncontrolled overflow weirs (approach 3), typically used to model emergency spillways. Despite real BDAs having various flow paths, we wanted to understand if non-porous physical blockage could effectively represent BDAs, or if “intra-structure” porosity is an important characteristic to capture.
-
Approach 4 tested whether a physically realistic increase in Manning’s n could reasonably represent site conditions for the BDA complex. Increasing roughness is widely used to model restoration features but it is non-physical and model results can be highly sensitive to n values. Because field-based estimates for roughness associated with BDAs are limited, we used an empirical Manning’s n relationship developed for large wood in streams (Addy and Wilkinson 2019). We wanted to understand if flow resistance alone could effectively represent BDAs.
-
Approach 5 explored a less-commonly used “circle” terrain modification, typically used for modeling bridge piers in HEC-RAS. The RnT model required over 2,600 vertical posts to represent all BDAs. We wanted to see if the time cost was worth the benefits of this approach. The small vertical posts created opportunities for more interstitial flow paths, so we wanted to understand the influence the shape of physical blockage has on modeling results of BDAs.
-
Approach 6 explored a new HEC-RAS feature, the Porosity and Flow Drag Layer, released in version 6.6 (2024). This layer allows a user to apply sub-grid obstruction volumes to the model domain using porosity, drag coefficients, and height parameters. We set a linear drag coefficient of 0 s-1 and a quadratic drag coefficient of 0.5 ft-1, because inertial forces dominated the modeled flow conditions, however parameterization should be further explored. All regions outside of these 6-ft wide polygons were set to 0-ft thickness, so that porosity and flow drag had no hydraulic affect to the rest of the model domain. We wanted to understand if porosity alone could effectively represent BDAs.
-
Approach 7 tested a combination of a non-porous physical blockage (approach 2), with flow resistance from increased Manning’s n (Approach 4). We wanted to understand if this combination improved representation of BDAs by accounting for both physical blockage and flow resistance.
-
Approach 8 tested if the weir equation can assist in computing the terrain modifications of approach 2. After running approach 2, we noticed higher computational errors at repeat cells near BDA crestlines. Because of this, we tried centering weirs on the downstream edge of all BDA crestlines to see if the weir equation would improve computations, hopefully resulting in decreased errors and/or faster run times.
-
Approach 9 tested another combination of a different non-porous physical blockage (approach 5), with flow resist-ance from increased Manning’s n (Approach 4), for the same reasons as Approach 7.
Table 4 A summary of the 9 modeling approaches for representing BDAs, with photos of what the modeled feature looks like in HEC-RAS Mapper and a description of how each approach was constructed in the 2D mesh. For a full-size version of this table, download the article PDF.
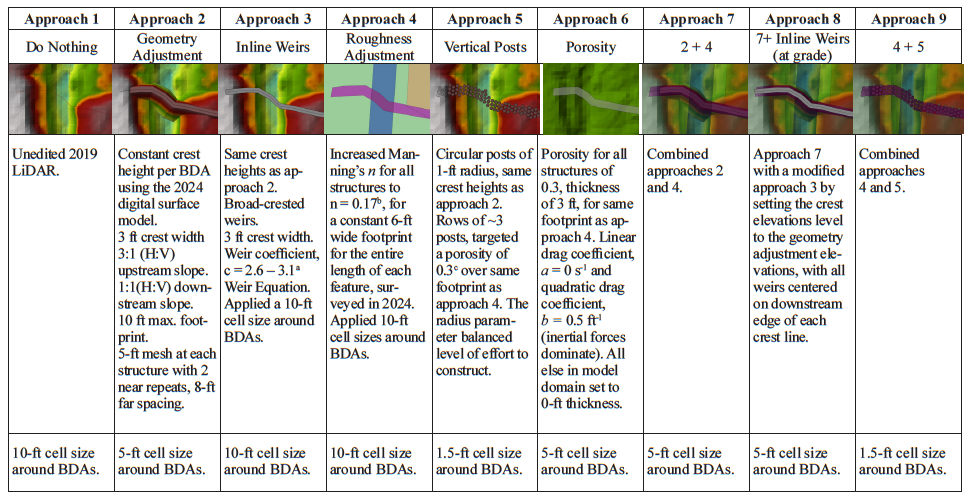
Notes: aTested a range of recommended weir coefficients (Brunner 2025b).
bBased on a positive relationship of roughness to channel slope normalized by drainage area for naturally occuring large wood features (Addy and Wilkinson 2019)
cThis is a starting point; other studies have tested more conservative porosities (10%) for natural beaver dams (Shultz 2025).
3.2.6. Criteria for Evaluation
This initial modeling guidance aims to support BDA projects across a range of design objectives, hydrogeography, beaver activity, and project goals and requirements. The proposed criteria reflect this purpose.
The selected structural representations of BDAs were evaluated based on how they each performed under the following preliminary criteria:
- Reasonably representative of overall site conditions
- Adjustable to plausible futures and site evolution (e.g., beaver colonization)
- Informative for design and permitting
- User-friendly
Three criteria were developed at the outset, with additional factors identified during the RnT site modeling process. First, results should reasonably reproduce the observed WSEs, general inundation extents, and expected velocities through the project site. We evaluated each approach based on its ability to represent the full range of flow states through a dam (Ronnquist and Westbrook 2021; Aguirre et al. 2024). Evaluation of approaches also considered the level of effort required to adjust the model for future site evolution scenarios: for example, adjusting the dams in response to potential beaver activity, adjusting for sedimentation behind a structure (Pollock et al. 2007; Scamardo and Wohl 2020; Dunn et al. 2024), and adjusting roughness partitioning to account for stage-roughness variability (Green and Westbrook 2009; Bledsoe et al. 2011). Another criterion assessed whether results from each approach could be utilized for targeted modeling efforts related to regulatory requirements or design objectives, such as fish passage, floodway insurance mapping, or comparing design alternatives. Finally, the evaluation included user experience considering the degrees of freedom for each approach, required expertise, and computation time.
4. Results
4.1. Decision-Support Tool
4.1.1. Presentation of the Proposed Tool
The proposed decision‑support tool (Figure 3) serves as a first step toward helping practitioners identify situations where hydraulic modeling may add value to a BDA project. The tool assumes that a stream restoration project has already identified a site considered suitable for BDA implementation. While existing guidance documents (Wheaton et al. 2019; Pollock et al. 2023), discuss factors influencing BDA site selection, they highlight that ongoing research is needed to better define site suitability and emphasize the importance of site-specific expert judgement. We prioritized “early off‑ramps” that identify scenarios where specific design questions could reasonably benefit from the additional insight that modeling provides. As users progress through the tool, there are cases where the situations become less clear‑cut; in these cases, the tool encourages practitioners to consider a broader understanding of watershed processes, conditions beyond the immediate project reach, and plausible future scenarios such as beaver recolonization or progressive dam‑building. This tool helps project designers and proponents manage expectations across the site and understand the implications of a wider envelope of potential project outcomes and how the system may evolve through time.
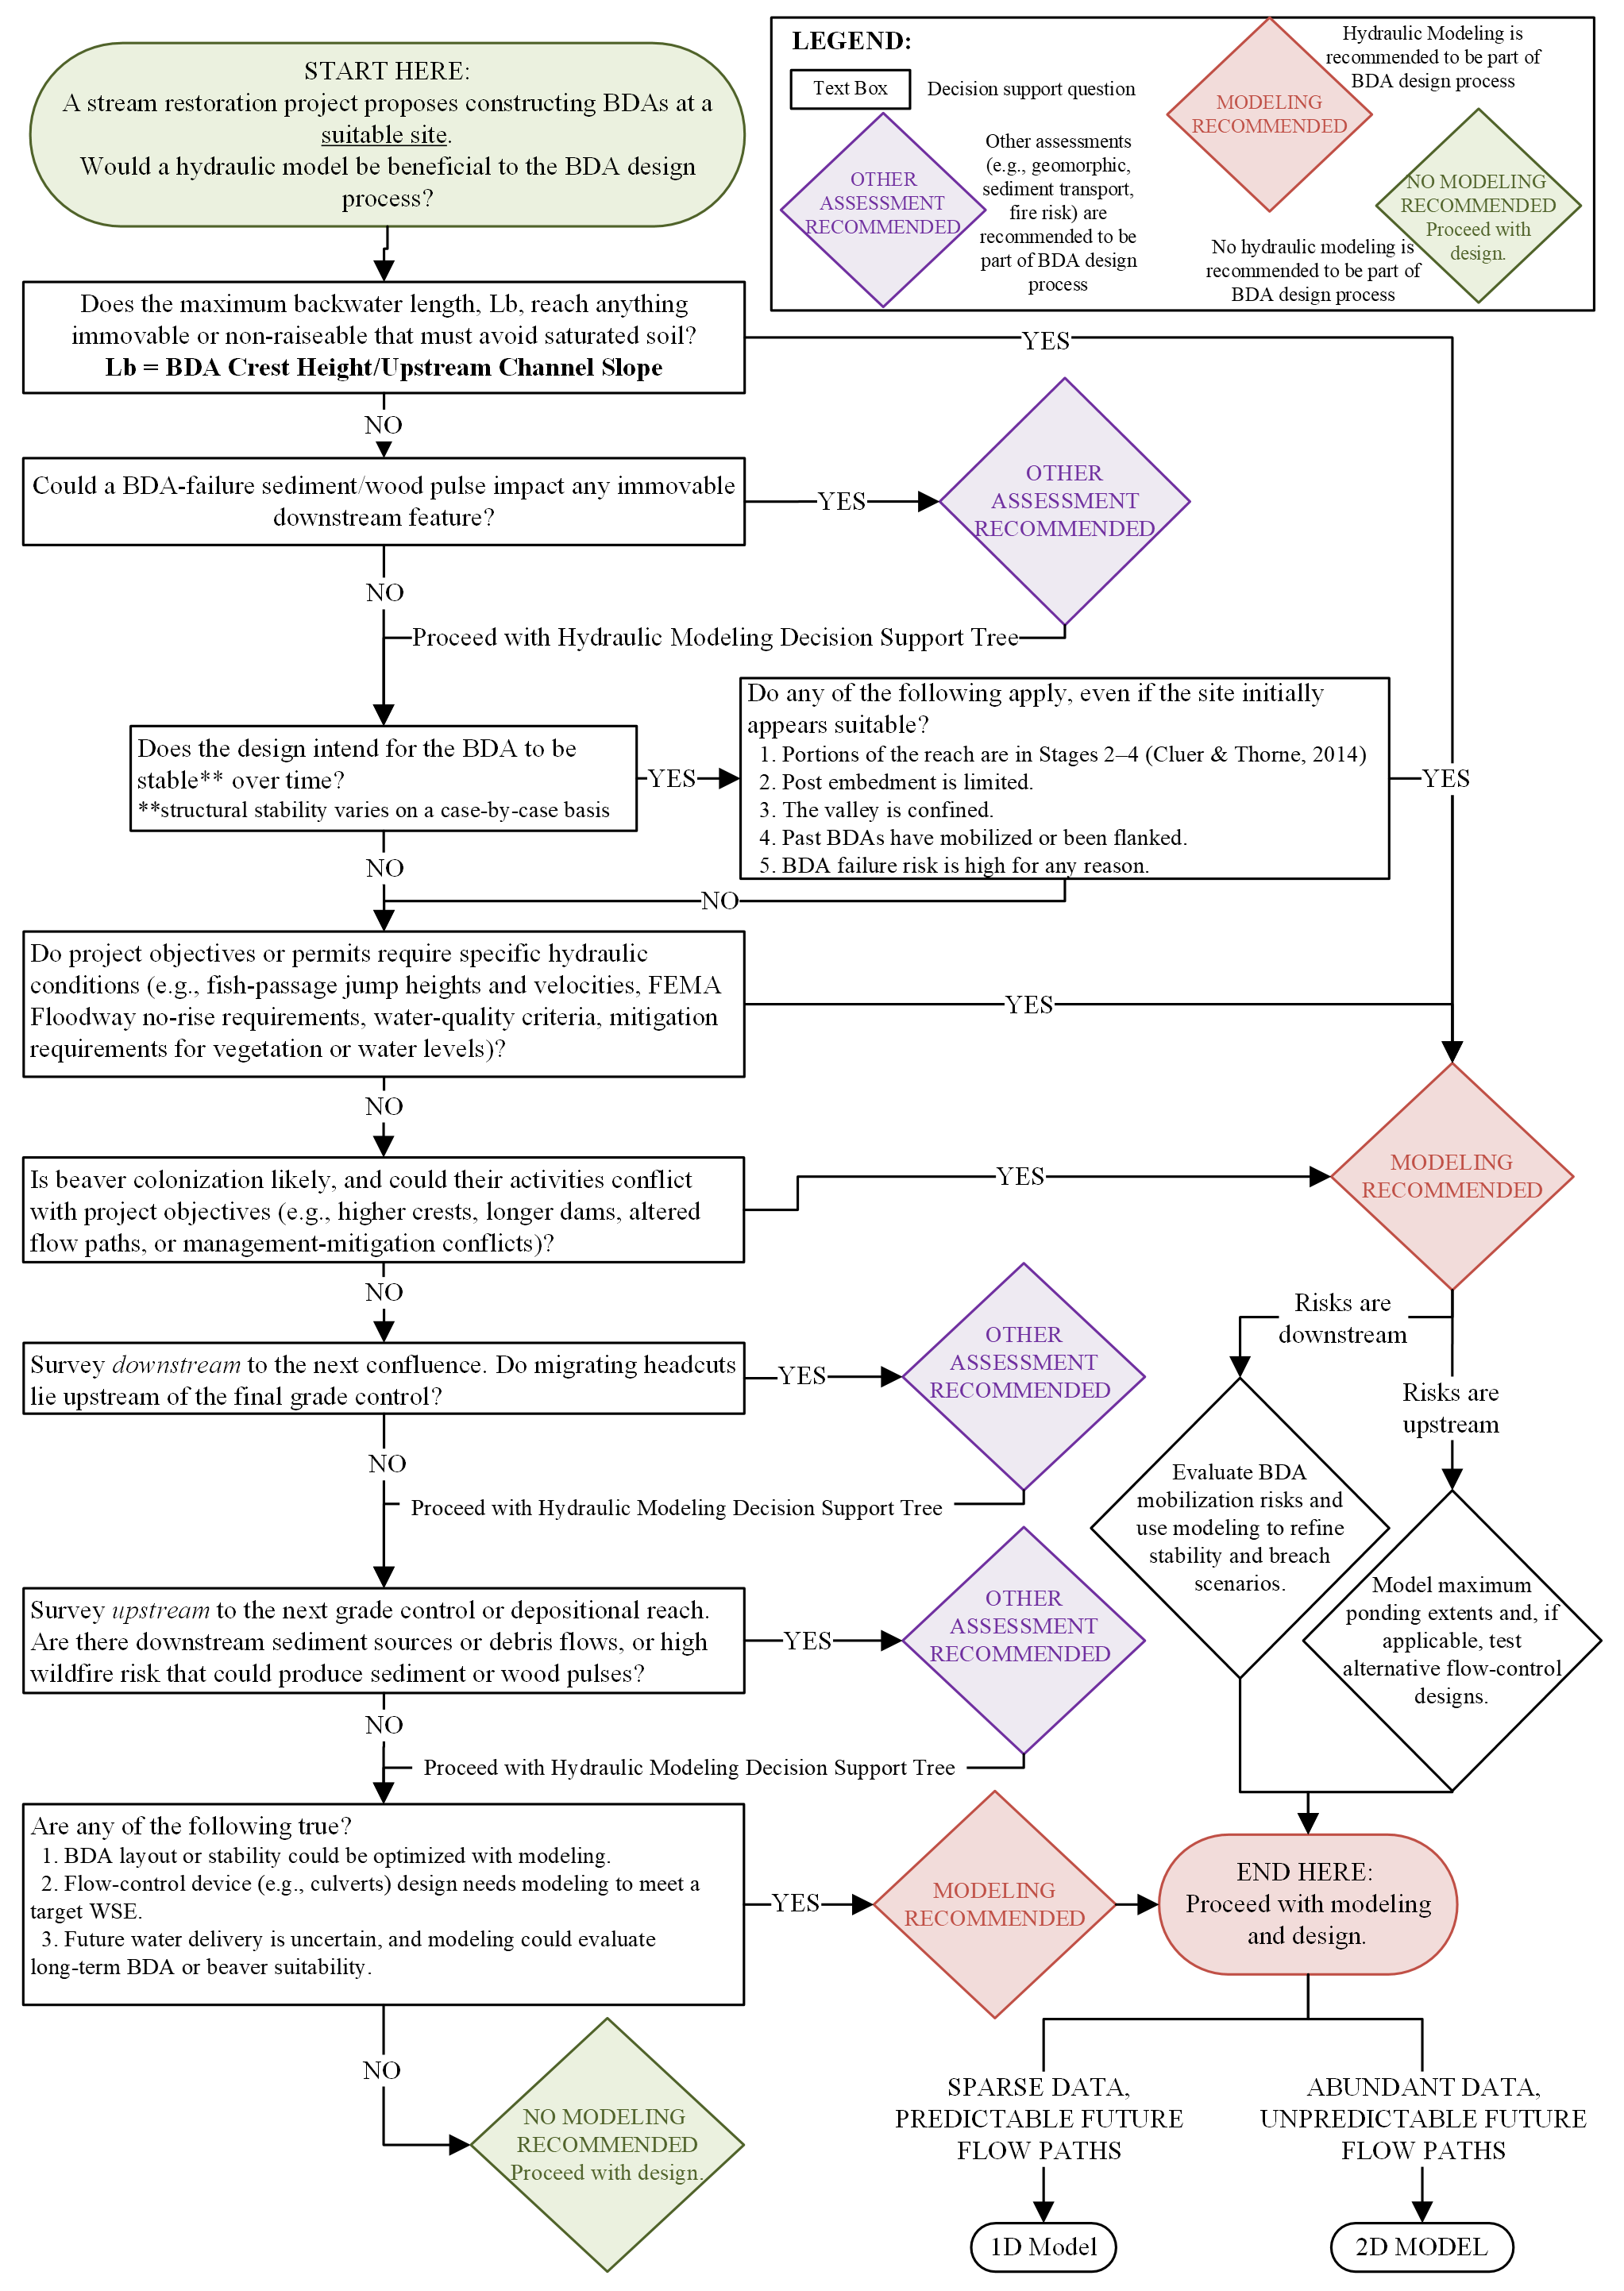
Fig. 3. Decision-support tool for identifying situations where hydraulic modeling may benefit a BDA design project. For a full-size version of this figure, download the article PDF.
The decision‑support tool concludes with the 4 possible outcomes: modeling recommended, modeling needed to address specific risks, other assessment recommended, and no modeling recommended. For example, modeling is recommended when saturated water conditions may affect upstream assets, and in such a case, modeling should focus on upstream water surface elevations and consider conservative or high‑risk scenarios. If the tool recommends modeling, the user is encouraged to weigh time, resources, available data, expertise, and level of modeling effort against the benefits of modeling. In some cases, the tool suggests other types of assessments, in addition to, or in lieu of hydraulic modeling. These could include geomorphic analyses, evaluations of sediment or wood pulses, or stochastic assessments of potential natural disturbances such as wildfire. The decision‑support tool outlines questions that these non‑hydraulic analyses should address, such as sediment and wood implications of dam blowout, downstream headcut migration, or potential changes in sediment supply. We highlight that the intended level of BDA stability will vary on a case-by-case basis through engineering judgment, since structural stability for these restoration features is a relative term. Finally, the intended level of BDA stability varies by project context, and engineering judgment remains essential. Structural stability for BDA‑type features is inherently relative rather than absolute, and the decision‑support tool is intended to aid, not replace, practitioner expertise in determining what level of analysis is appropriate for a given design.
4.1.2. Tool Demonstration
Applying the decision‑support tree to the RnT site indicates that hydraulic modeling is not recommended, even though RnT serves as an excellent demonstration site for testing modeling approaches. As a user works downward through the tree, the RnT project site has an upstream dirt road crossing; however, this crossing is fairly low-use and low-risk and the potential consequences of flooding are minimal, making hydraulic analysis a low‑value investment. There are also no major concerns downstream toward the SF South Platte confluence. While BDAs were constructed with persistence in mind to improve habitat quality, the design process did not include stability calculations. No specific hydraulic questions guided permitting or project objectives, and the project encouraged natural riverscape evolution through beaver modifications. Although wildfire risk exists in this watershed, and that risk is influenced by beetle kill and climate projections, there is no evidence of significant upstream sediment or wood pulses nor notable downstream headcuts. The design team’s strong experience, combined with routine monitoring and adaptive management, further reduced the need for model‑based design support. Flow adjustment devices are not a part of this project, and future hydrologic conditions will be primarily determined by future climate and beaver activity, as all water diversions start downstream. The application of the decision-support tree to the RnT site suggests that the costs and effort of hydraulic modeling would outweigh the potential benefits for this particular project.
When applying the decision‑support tool to Thompson Creek, the flooding of infrastructure (the bridge, road, or fire department property) is highlighted as a key consideration. The decision tool indicates that hydraulic modeling may add value by helping manage risks, meet permitting requirements, and refine BDA design choices. Newman Lake Road bridge is 350 m upstream of the first BDA structure built in 2021, and the Newman Lake Fire department property borders the flat open floodplain delta where this project will be implemented. Just 100 m downstream of the last proposed BDA structure, Thompson Creek flows into Newman Lake, which is used by much of the surrounding community for recreational activities, including power boating. Although wood loading historically occurred in Newman Lake, BDA design seeks to limit mobilization risk to avoid undesirable floating debris. Local flood permitting requires evaluation of water‑surface elevation changes, making hydraulic modeling a useful tool for assessing before‑and‑after conditions. Because Thompson Creek is straightened and frequently spills out of its banks across the delta floodplain, a 1D model can help approximate upstream backwater effects on the road, bridge, and fire department property. Depending on mobilization risks and expected ponding, a 2D model may offer additional clarity on BDA stability and design configuration. Any future work upstream of the bridge and road would strongly benefit from 2D modeling, given the flat, expansive floodplain and the potential for flow‑path‑dependent overtopping. Because beaver colonization is unlikely, modeling as‑built and anticipated adaptive‑management conditions should be sufficient.
Finally, applying the decision‑support tool to the Towaliga River site highlights upstream infrastructure considerations and the permitting and monitoring requirements of the mitigation program. Therefore, the decision-support tool indicates that hydraulic modeling can meaningfully support project objectives. It also highlights the need to consider future conditions of this site due to the signs of existing beaver within the project extent. Possible beaver colonization and management of the BDAs could likely occur within the planned mitigation monitoring period (on the order of 5 years – 10 years) as well as after the monitoring concludes. Because of the complex project objectives connected to mitigation credits, and the potential for possible futures with beaver-management of the system, leading to complex flow paths on the floodplain, a 2D hydraulic model provides the level of detail needed to assess flow complexity and support defensible design and monitoring decisions.
4.2. Hydraulic Modeling Approaches
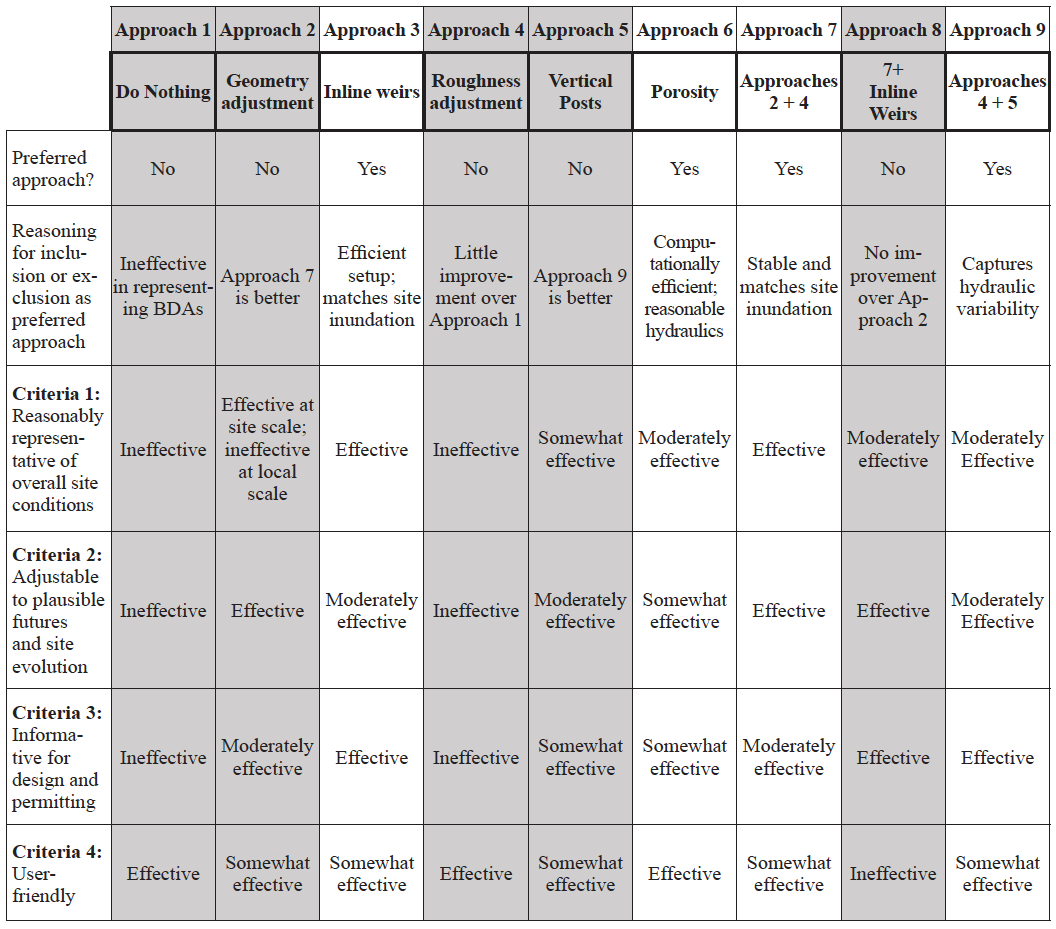
The 9 approaches exhibited varying performance across multiple criteria and highlighted significant benefits for representing BDAs as vertical posts or inline weirs, under current model capabilities. Of the 9 approaches tested, 4 were identified as preferred approaches due to their stronger performance across the evaluation criteria (Table 5). Approaches 1 and 4 were ineffective at representing site conditions, while approaches 2 and 5 required roughness adjustments to be effective, making approaches 7 (referred to as geometry adjustments) and 9 (referred to as vertical posts) preferable. Approach 8 did not produce the anticipated improvements as hoped for and resulted in a considerably longer run time than the rest of the approaches. The 4 approaches selected as preferred approaches (approaches 3, 6, 7, and 9) are emphasized in the following results sections, and conclude with modeling recommendations for Thompson Creek and Towaliga River sites.
Table 5 Performance summary of hydraulic modeling approaches based on evaluation criteria. Gray columns denote the approach is not preferred and therefore is not emphasized in analysis of results. For a full-size version of this table, download the article PDF.
4.2.1. Inundation Extents and Water Surface Elevations at the Site-Scale
Of the 4 preferred approaches, the porosity (approach 6) yielded the inundation extent that most underestimated actual inundation across the project site, at the tested value of 0.3 for porosity. The combination approach of vertical posts with added roughness adjustments (approach 9) yielded much improved floodplain inundation. Still, this inundation slightly underrepresented observed conditions. Inline weirs and geometry adjustments (approaches 3 and 7, respectively) produced similar inundation extents that best approximated aerial imagery (Figure 4).
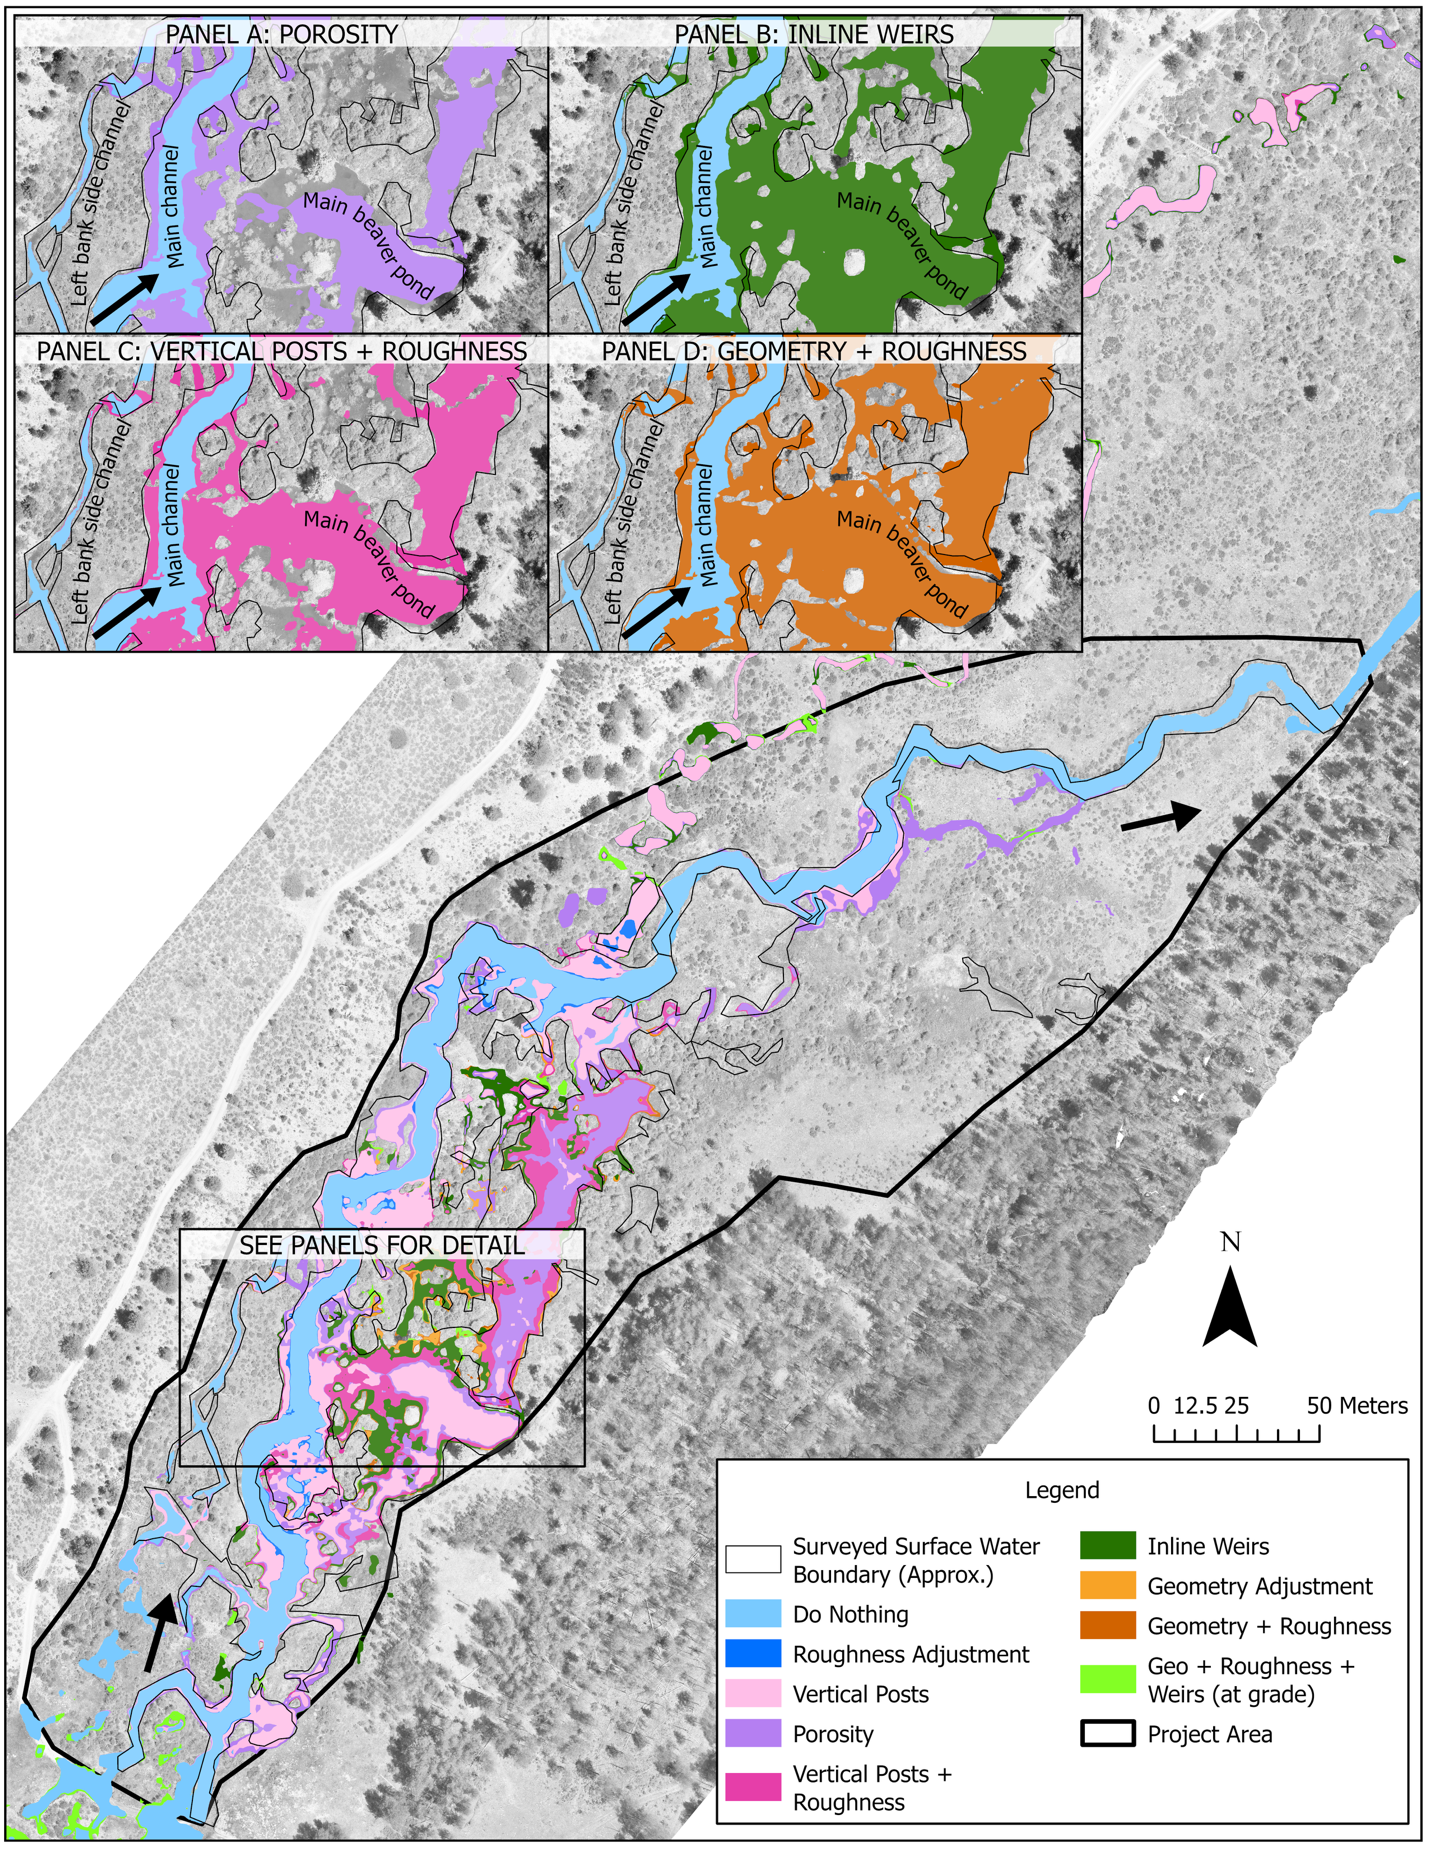
Fig. 4. Inundation extents for all modeled approaches. Black arrows indicate flow direction from southeast to north-northeast. Original aerial imagery courtesy of Ecometrics.
Although the evolution of restored conditions prior to 2024 were not modeled, 2022 – 2023 aerial imagery shows that inundation looked more similar to the inundation results from approaches using vertical posts (approach 9) and porosity (approach 6). In this way, if a model is intended to anticipate inundation extents as a site evolves with beaver, it may be useful to model using 2 methods to bracket a range of possible site evolutions over diverse temporal scales. In the case of RnT, vertical posts (approach 9) or porosity (approach 6) could be used to model realistic short-term conditions, and inline weirs (approach 3) could be used to model longer-term conditions as beaver manage and build out a project site.
WSE results consistently showed the greatest variability among approaches at ponding locations just upstream of the BDA structures. The inline weirs (approach 3) and porosity (approach 6) produced continuous WSE profiles along the approximate thalweg longitudinal profile, but geometry adjustments (approach 7) and vertical posts (approach 9) showed discontinuous steps in the WSE profiles across the BDAs. This outcome reflects how the model computes WSE: using the physical modifications for the vertical posts and geometry adjustments, while applying the weir equation for the inline weirs or resistance for porosity adjustments. Similarly, shear stress and velocity plummet to unrealistic values of 0 ft/s at these WSE profile discontinuities for the geometry adjustments and vertical posts. This is important to note if a continuous WSE or velocity profile is a desired modeling output, or if there are questions about local BDA hydraulics when applying terrain modification approaches (i.e., vertical posts or geometry adjustments).
Sensitivity testing of weir coefficients (C = 2.6 and C = 3.1). showed very minor differences in WSEs and velocity profiles throughout the project site reach. For C = 2.6, WSEs were generally 0.003 m – 0.01 m higher than for C = 3.1, particularly in areas of ponding upstream of BDA structures. For C = 2.6, velocities were about 0.03 m/s – 0.09 m/s slower than for C = 3.1, particularly just downstream of BDAs where velocities are higher.
We compared modeled WSE to observed WSE, consisting of recorded WSE points from the 18 June 2024 survey and selected water level loggers. These comparisons generally corroborate inundation extent trends. The inline weir, approach 3, overestimated WSE at observed locations by an average of 0.18 m, while porosity and geometry adjustments (approach 7) tended to overestimate WSE at observed locations, with modeled values averaging 0.10 m higher. Vertical posts (approach 9) modeled WSE 0.09 m higher than observed, which is the preferred approach that modeled WSE closest to observed data under the modeled flow conditions. Because flow data uses approximate discharge rather than an observed flow, these comparisons do not serve to validate the model. Instead, the comparison analysis identifies general trends across the preferred BDA approaches to recommend modeling schemes.
4.2.2. Hydraulic Velocities and Flow Variability at the Individual BDA
Approach 1 does not represent any BDAs and was therefore assumed to approximate the upper bound of all possible velocities at the site. Because no observed velocity measurements were available, we used results from approach 1 as a reference for identifying plausible velocity ranges at BDAs under site conditions. Similar to the use of water surface observations, the objective was not to determine exact expected velocities but rather to establish reasonable bounds and identify potential outliers (i.e., unrealistically high velocities from model artifacts) among the tested approaches. We estimated most velocities up to 1.0 m/s (3.4 ft/s) through BDAs based on the do nothing approach. Some velocities exceeding 1.5 m/s (5 ft/s) seemed possible through select BDAs yet highly unlikely under the flow applied to the restored conditions simulations.
Although geometry adjustments (approach 7) and inline weirs (approach 3) both produced similar inundation extents that reasonably reproduced site conditions, the inline weir approach performed best at modeling maximum velocities through the BDA structures. Improved performance for approach 3 could have been due to the inclusion of the weir equation, which helps compute flow going over the BDAs and maintains better model stability compared to the geometry adjustment (approach 7).
In the geometry adjustment (approach 2), maximum velocities spiked over 1.4 m/s (>4.5 ft/s) in some locations and dropped to 0 m/s in other locations because of discontinuity in water surface elevations at some BDAs. When the roughness adjustment approach was combined with the geometry adjustment (approach 7), maximum velocities through BDAs were generally less than 1 m/s (3 ft/s). This shows the utility of the increased roughness layer to help refine local hydraulics. Even with roughness adjustments, the water surface elevations still showed some discontinuities along the thalweg longitudinal profile, which resulted in velocities dropping to 0 m/s across some of the BDA structures. This would not be the best approach for situations for modeling efforts that seek to use hydraulic modeling for design guidance on BDA structural stability, orientation or configuration of the structures, since velocities and shear stress are not well reported through the structures.
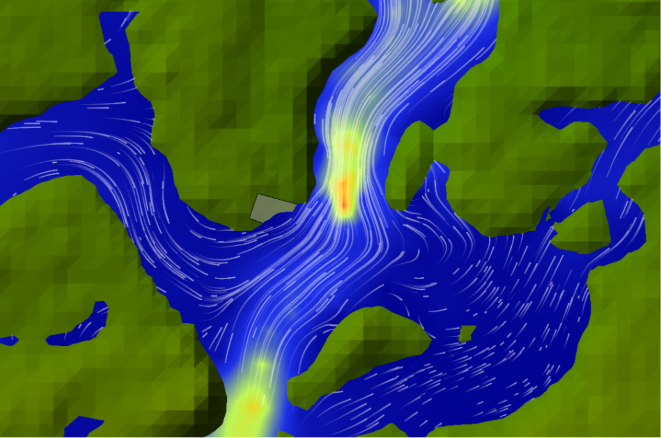
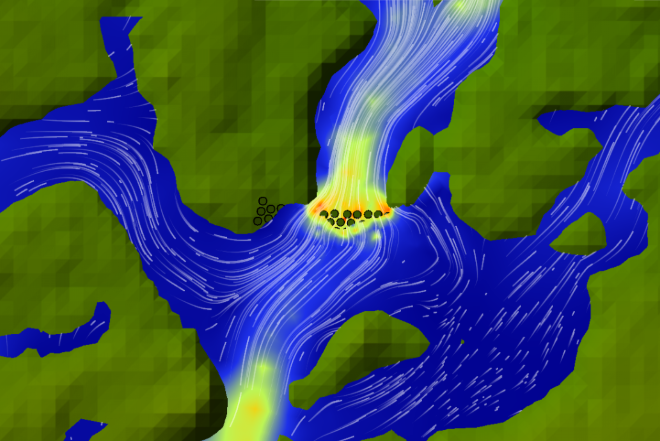
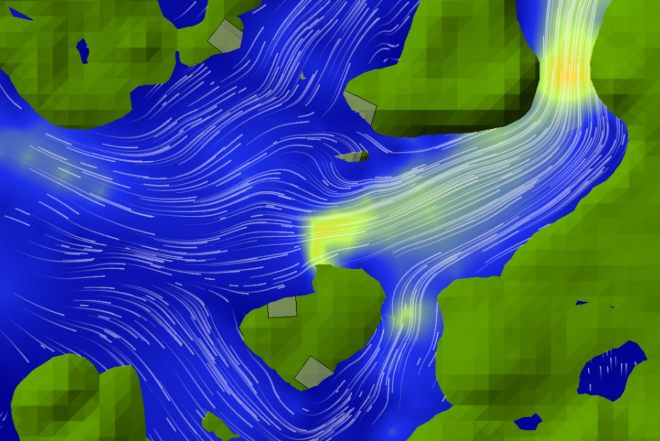
Although vertical posts (approach 9) and porosity (approach 6) resulted in lower inundation extent, particularly throughout the floodplain at the primary beaver pond and lodge, the local hydraulics through the BDAs reasonably replicated expected restored conditions. Similar to improvements in the geometry adjustment approach with the addition of the roughness adjustment (approach 7), the vertical posts also showed improved maximum velocity results when combined with the roughness adjustment (approach 9, Table 6 and Figure 5). For example, at one BDA structure, the velocities using the vertical post approach exceeded 1.6 m/s (exceeding expected velocities), but when combined with the roughness adjustment, velocities through the structure decreased to a more reasonable 1.0 m/s.
Table 6 Summary of selected approaches illustrating local velocities through 2 selected BDAs (as shown in Figure 5), showing how the vertical posts best represent the hydraulic heterogeneity of velocity patterns through the dams.
| Photo |
Approach 3 |
Approach 6 |
Approach 9 |
|---|---|---|---|
| A | 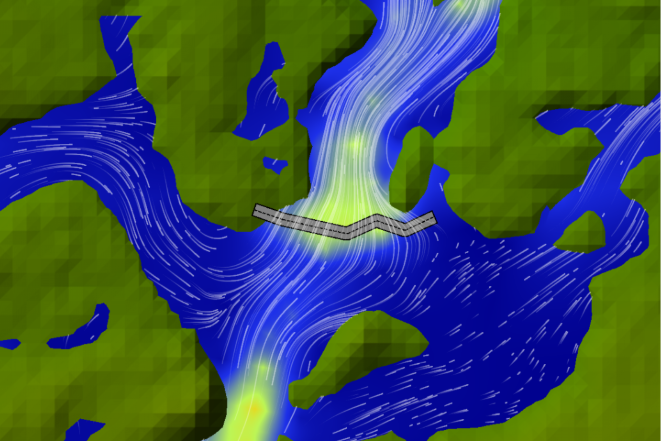 |
 |
 |
| B | 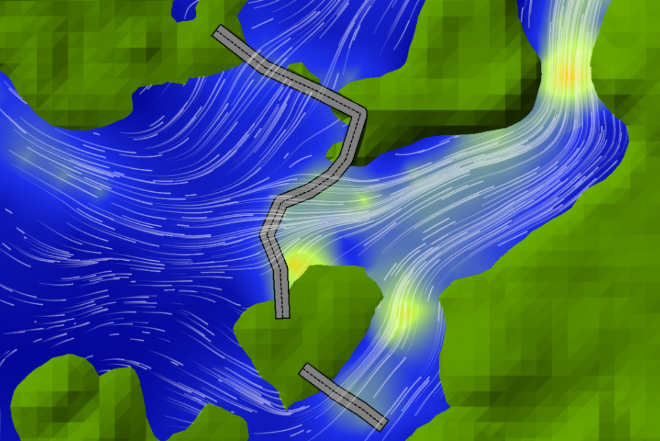 |
 |
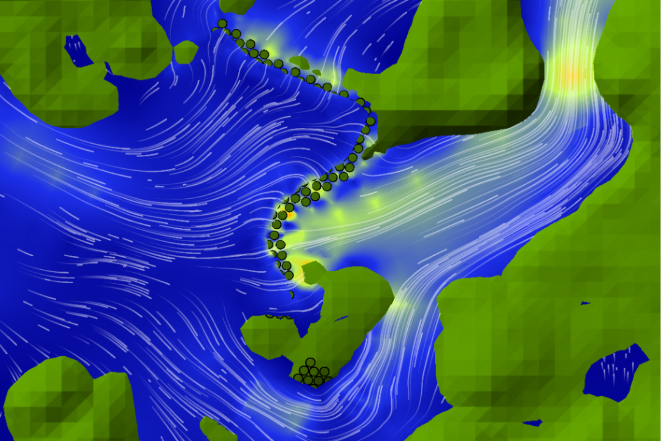 |
*Note: Green, yellow, orange, and red represent increasing velocities (2 ft/s up to 5 ft/s), respectively, and blue represents still water or lower velocities (<2 ft/s).
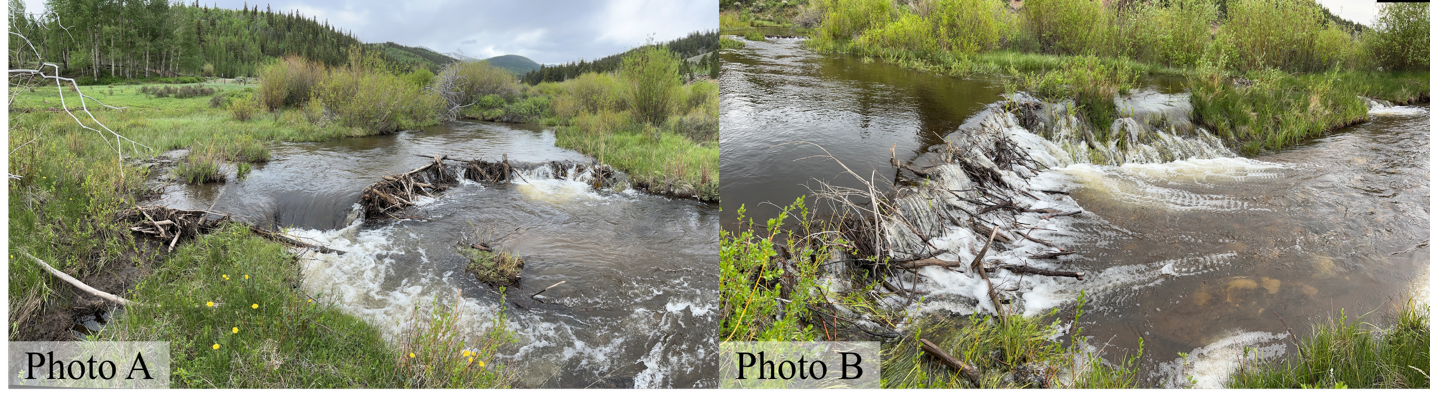
Fig 5. Photos A and B, corresponding to the selected approaches featured in Table 6. Images courtesy of Ecometrics.
4.2.3. User Experience and Considerations for Selected Approaches
Simulations using inline weirs developed model instability, particularly at closely spaced BDAs, so we eliminated several BDAs (<10% of total BDAs modeled) from this approach to improve model stability for this effort. The inline weir approach still produced some of the greatest inundation extents and the highest WSEs across all observed edge of water survey points; the elimination of several weirs did not significantly compromise the ability to compare general trends across the selected modeling approaches.
The geometry and weir approaches required similar levels of effort to build, but the geometry approach used a finer mesh at the BDAs (5-ft cell spacing) to capture terrain modifications. The vertical posts required even greater resolution to represent detailed terrain features, using a 1.5-ft cell spacing at each of the circular terrain modifications representing the BDAs, and smaller simulation time step of 0.3 s (compared to 0.5 s for the geometry adjustment approach). Despite these refinements, computation times remained comparable. On the other hand, the geometry and weir combined (approach 8) resulted in a 12-fold increase in computation time. For this approach, we aligned all inline weir breaklines along the downstream edge of the BDA crest to accurately capture tail water elevations. We applied the weir equation to all BDA structures, but results indicated that some BDAs were more submerged than the plunging conditions we assumed. For these submerged BDAs, it is recommended to use the Normal 2D Equation, which computes flow using standard open-channel hydraulic relationships, rather than relying on the weir equation.
Roughness adjustments were the easiest to apply and modify, but this approach still poorly replicated site conditions. Porosity showed excellent flexibility for project evolution and reasonably replicated site conditions; however, physically realistic values for porosity and flow drag parameters are needed for this tool to be a viable approach. Additionally, porosity results are highly sensitive to mesh refinement and the porosity parameter. Results looked more like the do nothing approach (approach 1) when 10-ft cell spacing geometry was applied, therefore a 5-ft cell size at the BDAs was optimal for using porosity. When we tried decreasing porosity from 0.3 to 0.1, we noted immediate model instability (leading to a 0.19 ft WSE error at a repeat cell and longer computation times), despite decreasing the time step from 0.5 s to 0.2 s, respectively. To represent evolving site conditions, geometry adjustments and inline weirs can be modified more easily than to vertical posts, which require more effort to edit the parameters and reposition within the model domain.
4.2.4. Recommendations for Thompson Creek and Towaliga River
Based on results from RnT, the Thompson Creek site would be well-suited for representing all 18 features as vertical posts with roughness adjustments. BDAs should be modeled with lower porosity — achieved by increasing post radius or adding more posts — to simulate their impoundment effect. The other roughness features not intended to pond water can be modeled using this same approach with relatively higher porosity by decreasing post radius or adding fewer posts. Cost estimates for this project report 100, 8-ft pine posts and 329, 10-ft pine posts required for constructing these features, so fewer than 500 structures would require less effort to set up in modeling space than the 2,600 required for the RnT site. The repetitive but useful “copy and paste” feature in HEC-RAS significantly facilitates the addition of shapes and would make this a relatively simple effort for an experienced modeler. Because there are 18 structures (fewer than RnT), and the channel and floodplain may not evolve as rapidly as the RnT site did due to beaver activity, the vertical post approach could assist with design configuration and analysis, as well as with future conditions scenarios, with a reasonable level of effort. If it is still desired to explore “worst-case” ponding for upstream concerns of the bridge, road, and fire department property, it is recommended that all BDA structures are represented as inline weirs, and the roughness features are represented as vertical posts with increased roughness adjustments (Manning’s). Future phases of floodplain structures adjacent to the 2021 project might consider using this same approach for either 1D or 2D models. In HEC-RAS, the 1D model does not provide the same terrain modifications capabilities as the 2D model in RasMapper; however, the effect of the vertical posts can be approximated by adding a series of closely spaced, horizontally aligned permanent ineffective flow areas (Stout et al. 2017). Any future phases of in-channel work upstream of the road would be best served with a 2D model, due to more infrastructure and higher risk within the upstream reach of Thompson Creek.
With beaver already within the Towaliga River project area, the proposed mitigation site would also be well-suited for a 2D hydraulic model that represents a larger range of potential site evolution scenarios, and models the BDAs as inline weirs during early design phases (conceptual and 30% – 60% design level) and as vertical posts in later design phases (60% – 100% design level). This approach would enable the design team to broadly consider scenarios where beaver may interact with the design, using what is known about the length and height of existing beaver dams, and how project objectives related to mitigation credits might be met over time. These simulations would use weirs that would be easy to create and adjust in initial modeling phases. Then, as BDA stability analysis is required, the proposed BDAs can be modeled as vertical posts, to refine designs based on the expected shear stress and velocities through each structure.
5. Discussion
We present 2 main outcomes in this subject-area review, both of which aim to improve the intelligent application for applying hydraulic modeling to BDA projects.
The first outcome is a decision-support tool that prompts the user to consider a wide variety of primary considerations of BDA design and how hydraulic modeling may be a tool for defending concerns or enhancing project benefits. Numerous studies reference the suite of scenarios for when modeling may benefit BDA design: to understand flooding extent (Pitcairn 2023), downstream hydraulics and hydrology (Senior et al. 2022; Muhawenimana et al. 2023), and dynamic beaver-landscape evolution (Green and Westbrook 2009; Nyssen et al. 2011; Karran et al. 2018; Stout et al. 2017). However, the accelerated interest in and use of BDAs as a restoration approach have the potential to outpace research on how to best represent these dynamic structures in hydraulic models (Pilliod et al. 2018; Lautz et al. 2019). Moreover, it is important for practitioners to firmly recognize hydraulic modeling limitations. Because BDAs can alter groundwater storage and subsurface flow paths, restoration outcomes may extend beyond reach-scale hydraulics, and hydraulic modeling alone cannot fully predict geomorphic responses such as sediment transport and channel adjustment (Pollock et al. 2014; Nash et al. 2018; Bobst et al. 2022). The decision-support tool encourages practitioners to consider these limitations, as well, when evaluating whether or how modeling should be applied.
The second outcome of this subject-area review is preliminary guidance for the representation of BDAs in existing hydraulic models through multi-criteria evaluations (Table 7). We scored approaches based on their effectiveness for each criterion using insights from the case study, with scores intended for relative comparison rather than absolute evaluation. The selected approaches differ in their effectiveness to represent site conditions, accommodate possible future scenarios (e.g., beaver colonization of the BDAs), support design and permitting, and ensure user-friendliness (e.g., run times, model stability).
Table 7 Multi-criteria evaluation of selected modeling approaches for representing BDA structures. For a full-size version of this table, download the article PDF.
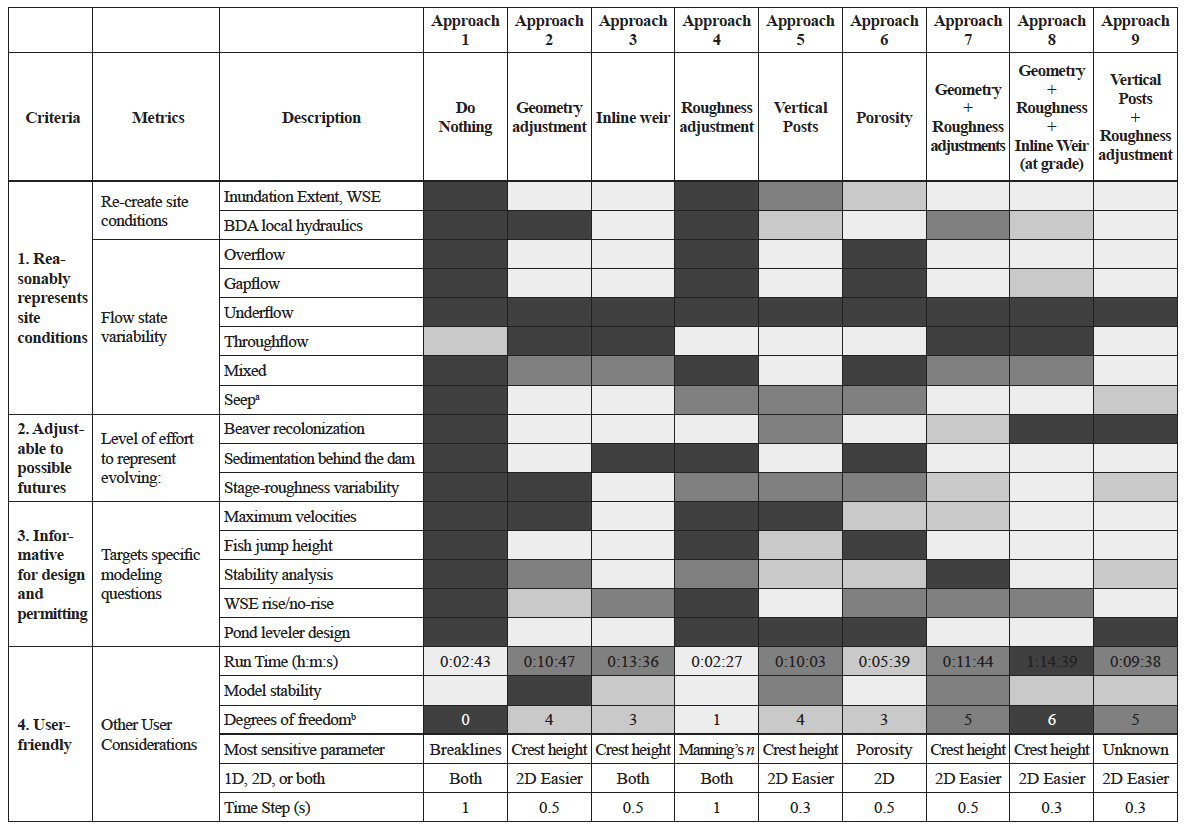
Key: Ineffective = darkest gray, Somewhat effective = lighter gray, Moderately effective = light gray, Highly effective = lightest gray/white.
aSeep flow: water flowing beneath the dam structure, as in spring-fed dams, lower head usually and very limited surface water transmissivity
bExcluding spatial location (lat, long) of structure and mesh development (i.e., assumes locations and level of mesh resolution is already determined)
Two approaches stand out as the most robust and perform reasonably well over all criteria: vertical posts with roughness adjustments, and inline weirs. Vertical posts with roughness adjustments generally showed the most accurate hydraulic complexity through the BDA structures, as well as reasonable inundation extents for site conditions. We struggled to develop this approach efficiently in the current modeling interface, but as terrain modification tools improve, this approach could become a more streamlined and adjustable option. It may especially excel in sites where designers are concerned about sediment aggradation behind a dam. Sediment could be represented as a geometry adjustment through a longer extended triangular prism, with vertical posts on top of the added obstruction. A sensitivity analysis could be performed by changing the height of the geometry adjustment “wedge” behind the dam to mimic possible future sediment aggradation rates over time: low (e.g., 1.8 cm per year, [Dunn et al. 2024]) to high (0.47 m per year for highly incised and responsive systems, [Pollock et al. 2007]).
The inline weir approach is a strong competitor to the vertical posts approach because it can represent BDAs as they become less porous and as the site might evolve in response to beaver activity. Additionally, the weir equation provides better computational stability when representing flow over BDAs, and emerging research suggests that weir-based formulations can effectively reproduce observed hydraulic behavior in some cases (Hart et al. 2025). However, BDAs are dynamic, porous structures with hydraulic properties that can vary both seasonally and through time. Therefore, the recommendation to use the inline weir approach should be viewed as a robust modeling abstraction that captures dominant hydraulic responses, rather than as evidence that BDAs function as engineered weirs. This distinction emphasizes the need for caution when interpreting model representations as physically equivalent to the systems they are intended to simulate. In summary, both the vertical posts with added roughness, as well as the inline weir, are approaches that warrant strong consideration when matching design intent with available modeling features, amid current modeling capabilities, particularly in HEC-RAS.
While there is a suite of hydraulic, hydrologic, economic and ecologic benefits from beaver-managed landscapes, many hydraulic models, including HEC-RAS, fall short in capturing all these benefits. The unsteady 2D HEC-RAS models built for the case study did not account for the movement of sediment, vertical velocities, hyporheic exchange flows, or groundwater movement. Still, HEC-RAS is well acknowledged as a standard tool for design and permitting of BDAs, and the HEC-RAS models in the case study served their purposes for developing initial modeling guidance. This modeling effort demonstrates the utility of biannual high-resolution orthophotos and the DSM elevations for monitoring key components of a BDA project, particularly as beaver recolonize the site. We identified crest heights and dam lengths using the 2024 DSM elevations to develop the restored conditions model. Rapid monitoring processes, such as the capture of orthophotos and DSMs using drones, can be considered highly useful tools for adaptive management and monitoring of BDA projects going forward.
Additionally, this modeling effort identifies how local hydraulics vary based on the flow intensity experienced by the structure under analysis. For example, BDAs experiencing higher flows in the main channel showed maximum WSEs that were closer in range for the different approaches modeled, compared to beaver dams experiencing lower flow intensities in the floodplain. This result is related to the inundation extents that vary across the different modeled approaches, since the approaches performed more similarly closer to the main channel and, as the distance from the main channel increased, the ponding effects from each model approach changed. The do nothing approach and the roughness adjustment approach had the least floodplain inundation, while the approaches using geometry adjustments and inline weir techniques (approaches 2, 3, 7, and 8) had the highest floodplain inundation (even overestimating WSE in several locations). Conversely, velocities were more similar for structures in the floodplain than for the BDAs in the main channel, but all approaches generally showed lower velocities upstream of each structure and higher velocities through or just downstream of the structure, which is representative of velocity patterns through BDAs and beaver dams. Finally, shear stresses were more similar among structures in the floodplain compared to BDAs in the main channel. Shear stress is a function of flow velocity as well as Manning’s n (used to compute the drag coefficient in HEC-RAS), so all the approaches using roughness adjustments (approaches 4, 7, 8, and 9) resulted in shear stress that occasionally spiked near the structures. Shear stress is highly sensitive to roughness values, which is a good example that supports our general decision for selecting physically realistic values for all parameters (e.g., avoiding unrealistically high Manning’s n values).
In reality, the contribution of BDAs to the overall hydraulic roughness of the reach changes depending on river stage and other dynamic sources of roughness, such as floodplain vegetation (Bledsoe et al. 2011). Roughness values for the BDAs and floodplain landcover were not varied in the case study to isolate variability across the approaches representing BDAs. For this same reason, no combinations of approaches were explored within a single structure or across the project site (i.e., one approach was applied to every structure in the site at a time). Further modeling guidance should consider the dynamic roughness partitioning of a BDA project area over time, especially in cases where beavers colonize a site. Additionally, when building the computational mesh for a 2D model, an infinitely small cell resolution applied for all approaches could reflect the highest level of model complexity, but a higher resolution requires shorter time steps, resulting in significantly longer run times. Therefore, a compromise is required between cell resolution and practicality. Accordingly, cell resolution was varied among the different approaches based on the needed level of detail.
Additional research is needed to develop more comprehensive modeling guidance for BDA designs. Key research needs and possible future directions for modeling BDAs include:
- Explore regional testing of the decision-support tool to assess suitability, identify opportunities for refinement, and determine additional tools needed to address processes — such as groundwater dynamics and sediment transport — that hydraulic models alone cannot capture.
- Explore additional approaches not explored in this research scope. Some notable approaches include ineffective flow areas in 1D HEC-RAS, as well as alternative terrain modification shapes or inline weirs with culverts in 2D HEC-RAS.
- Although only 2024 restored conditions at Rough and Tumbling Creek were modeled for the case study, future modeling efforts might explore modeling the same complex through time to identify the changes in reasonable values for parameters through time (e.g., porosity, dam geometry changes after beaver colonization). Guidance and basis for parameterization should be verified in field, when possible.
- Analyze failure mechanisms in field designs, including scour and buoyancy, to better understand how, where, and when BDAs of different configurations tend to mobilize.
- Collect discharge, velocity, and channel geometry data at future sites to understand typical velocity and roughness ranges through BDAs or beaver dams, both in main channels and across floodplains.
6. Conclusion
Our 2 main objectives of this subject-area review were to develop a practical decision-support tool that helps practitioners identify situations where hydraulic modeling may benefit BDA project design, and to provide initial hydraulic modeling guidance on how to reasonably represent BDAs in the model space. The use of 3 case studies demonstrated the utility of the decision-support tool and provided real projects to test and propose selected approaches to represent BDAs in hydraulic models.
We tested and evaluated 9 methods to represent BDAs in a 2D hydraulic model of a BDA project that was recolonized by beaver to simulate conditions 3 years post-construction. Results demonstrated the variability in strengths and limitations of each approach: The evaluation identified major concerns with the roughness approach alone and showed clear advantages for modeling BDAs using vertical posts or inline weirs. Our findings fulfill an important first step toward developing guidance for when hydraulic modeling is recommended to support BDA design. We offer the following recommendations as best practices and guidance for representing BDAs in hydraulic models:
- Optimal modeling approaches for representing BDAs vary with the scale of interest, but the guiding principle is the approach that best reflects physical reality. If the BDA’s form and function resemble newly installed vertical posts, consider using approach 9 first; if the structure(s) behave more like a weir, try approach 3 first. Best practice may incorporate several different approaches throughout a BDA project site, depending on the design intent, function of the BDAs, and plausible range of site evolution.
- A roughness adjustment using physically based values (e.g., not n = 10) should not be used as the only approach for representing BDAs. However, when combined with other approaches, we observed roughness adjustments to be more representative of restored site conditions, leading to enhanced model performance, particularly in capturing local hydraulics around the BDAs.
- Conducting a sensitivity analysis of the parameters used to build each approach helps identify general trends and communicate modeling uncertainties.
- Uncertainties in model input parameterizations, in addition to the limitations of the selected approach(es) to represent BDAs and/or beaver dams, should be well-documented.
The best BDA-modeling guidance is centered on a solid understanding of the range of modeled features available to the user, and the strengths and limitations (and sensitivity) of each approach. The challenge is pairing the modeling intent with the best approach or set of approaches available.
Supplementary Material
The online version of this article contains a link to supplementary material that includes: Figure S1: Site map of 2021 Thompson Creek BDA project showing as-built locations of 18 restoration features, including a mixture of BDA-type stuctures and non-ponding roughness structures.; Figure S2: Thompson Creek during high flow; Figure S3 Site map of proposed Towaliga River BDA project showing locations of existing beaver activity and proposed BDA implementation; Figure S4 Representative channel cross sections of Towaliga River at the BDA project site; Figure S5 Existing beaver dams near Towaliga River mitigation site; Figure S6 General steps for developing the decision-support tool for assessing when and why to model a BDA project.
Acknowledgements
We would like to thank the Sunshine Charitable Foundation and Ducks Unlimited (DU) for supporting this research. We would also like to thank Mark Beardsley (EcoMetrics), and Sean Miller and Tony Greco (Nutter & Associates, Inc.) for sharing data and insights on the case studies. For hydraulic modeling support and data validation, we gratefully acknowledge UGA-IRIS staff, specifically, Kevin Samples and Matt Chambers; and we thank Will Mattison for managing and coordinating DU Fellowship research activities and professional engagements. Finally, we thank Ellen Wohl (Colorado State University) and Rhett Jackson (University of Georgia) for their guidance and valuable feedback, which helped shape the direction of this research.
Author Contributions Statement
Conceptualization: HG, BB; methodology: HG, BB; data analysis: HG; data curation: HG, SN; formal analysis: HG, BB, SN; writing — original draft: HG; writing — review & editing: BB, SN; supervision: BB; funding acquisition: BB; field site visit(s): HG, SN; project administration: BB; resources: BB, SN. AI-assisted language editing was used to improve sentence clarity and conciseness. No AI was used to generate content, analyze data, or interpret results. All authors have read and agreed to the published version of the manuscript.
Conflict of Interest Statement
This project was funded by the Sunshine Charitable Trust and Ducks Unlimited.
Data Availability Statement
The HEC-RAS model developed to inform the recommendations presented in this subject-area review is available from the corresponding author upon reasonable request.
Related Publication Statement
This paper was submitted to the University of Georgia as one chapter of Hattie Greydanus’s master’s thesis. The thesis has a delayed release of 2 years for publishing to the University of Georgia to avoid potential copyright issues with publishing in JEED.
References
Addy S, Wilkinson M. 2019. Representing natural and artificial in-channel large wood in numerical hydraulic and hydrological models. WIREs Water. 6(1389). https://doi.org/10.1002/wat2.1389
Aguirre I, Hood GA, Westbrook CJ. 2024. Short-term dynamics of beaver dam flow states. Science of The Total Environment. 919:170825. https://doi.org/10.1016/j.scitotenv.2024.170825
Beardsley M, Doran J. 2022 Park County beaver restoration assessment. EcoMetrics. https://doi.org/10.13140/RG.2.2.10830.74562
Beaver Institute. 2025. Landscape Restoration Gaps [YouTube]. Beaver Institute. [accessed 2025 May 18]. https://www.youtube.com/watch?v=cep-UxWbXM4&list=PL38czPqtBims25gi2P6gQRZAa28wFsHIr&index=17
Bernhardt ES et al. 2005. Synthesizing U.S. river restoration efforts. Science. 308(5722):636–637. https://doi.org/10.1126/science.1109769
BikePortland. 2020. City of Tigard relents to beavers; plans new Fanno Creek trail crossing at Scholls Ferry Road [Internet]. Portland (OR): BikePortland; [accessed 2025 Mar 12]. Available from: https://bikeportland.org/2020/07/21/city-of-tigard-relents-to-beavers-plans-new-fanno-creek-trail-crossing-at-scholls-ferry-road-318691
Bledsoe BP, Carney SK, Anderson RJ. 2011. Scale-dependent effects of bank vegetation on channel processes: field data, computational fluid dynamics modeling, and restoration design. In: Simon A, Bennett SJ, Castro JM, editors. Geophysical Monograph Series. American Geophysical Union; p 151–165 [accessed 2023 June 19]. http://doi.wiley.com/10.1029/2010GM000959
Bobst AL, Lowry CS, Daly C. 2022. Groundwater-mediated influences of beaver-mimicry stream restoration: a modeling analysis. Journal of the American Water Resources Association. 58(6):1036–1053. https://doi.org/10.1111/1752-1688.13044
Bouwes N et al. 2016. Ecosystem experiment reveals benefits of natural and simulated beaver dams to a threatened population of steelhead (Oncorhynchus mykiss). Sci Rep. 6(1):28581. https://doi.org/10.1038/srep28581
Brazier RE et al. 2021. Beaver: Nature’s ecosystem engineers. WIREs Water. 8(1):e1494. https://doi.org/10.1002/wat2.1494
Brunner GW. 2025a. HEC-RAS 2D user’s manual, version 6.6 [Internet]. Davis (CA): U.S. Army Corps of Engineers Hydrologic Engineering Center. https://www.hec.usace.army.mil/confluence/rasdocs/r2dum/6.6
Brunner GW. 2025b. HEC-RAS hydraulic reference manual, version 6.6 [Internet]. Davis (CA): U.S. Army Corps of Engineers Hydrologic Engineering Center. https://www.hec.usace.army.mil/confluence/rasdocs/ras1dtechref/6.6
Ciotti DC et al. 2021. Design criteria for process-based restoration of fluvial systems. BioScience. 71(8):831–845. https://doi.org/10.1093/biosci/biab065
City of Portland Environmental Services. 2024. Beaver management plan 2.1. City of Portland Bureau of Environmental Services. [accessed 2025 May 18]. https://www.portland.gov/bes/documents/city-portland-beaver-management-plan-best-management-practices/download
Corday J. 2022. Restoring Western headwater streams with low-tech process-based methods: a review of the science, challenges, opportunities, and case study results. American Rivers. [accessed 2024 Feb 6 ]. https://www.americanrivers.org/wp-content/uploads/2023/01/FINAL_LTPBR-White-Paper_Nov2022-SHARE1.pdf
Dittbrenner BJ et al. 2018. Modeling intrinsic potential for beaver (Castor canadensis) habitat to inform restoration and climate change adaptation Munderloh UG, editor. PLoS ONE. 13(2):e0192538. https://doi.org/10.1371/journal.pone.0192538
Dunn SB, Rathburn SL, Wohl E. 2024. Post-fire sediment attenuation in beaver ponds, Rocky Mountains, CO and WY, USA. Earth Surface Processes and Landforms. 49(13):4340–4354. https://doi.org/10.1002/esp.5970
Graham HA et al. 2020. Modelling Eurasian beaver foraging habitat and dam suitability, for predicting the location and number of dams throughout catchments in Great Britain. Eur J Wildl Res. 66(3):42. https://doi.org/10.1007/s10344-020-01379-w
Green KC, Westbrook CJ. 2009. Changes in riparian area structure, channel hydraulics, and sediment yield following loss of beaver dams. JEM. https://doi.org/10.22230/jem.2009v10n1a412
Hart J et al. 2025. Flume experiments reveal how beaver dam characteristics influence pond depth regulation. Journal of Hydrology. 662:133872. https://doi.org/10.1016/j.jhydrol.2025.133872
Karran DJ, Westbrook CJ, Bedard-Haughn A. 2018. Beaver-mediated water table dynamics in a Rocky Mountain fen. Ecohydrology. 11(2):e1923. https://doi.org/10.1002/eco.1923
Kinas H, O’Shaughnessy K, McLeod A. 2024. Alberta beaver beneficial management practices. Working with Beavers. https://www.workingwithbeavers.ca/files/Beaver_BMPs.pdf
Larsen A, Larsen JR, Lane SN. 2021. Dam builders and their works: Beaver influences on the structure and function of river corridor hydrology, geomorphology, biogeochemistry and ecosystems. Earth-Science Reviews. 218:103623. https://doi.org/10.1016/j.earscirev.2021.103623
Lautz L et al. 2019. Restoring stream ecosystem function with beaver dam analogues: Let’s not make the same mistake twice. Hydrological Processes. 33(1):174–177. https://doi.org/10.1002/hyp.13333
Lisle S. 1996. The use and potential of flow devices in beaver management. In: Proceedings of the 12th Vertebrate Pest Conference. Davis (CA): University of California. p. 114–117. https://www.zodion.nl/sites/default/files/2023-06/lutra_46-2.pdf
Macfarlane WW et al. 2017. Modeling the capacity of riverscapes to support beaver dams. Geomorphology. 277:72–99. https://doi.org/10.1016/j.geomorph.2015.11.019
Majerova M et al. 2015. Impacts of beaver dams on hydrologic and temperature regimes in a mountain stream. Hydrol Earth Syst Sci. 19(8):3541–3556. https://doi.org/10.5194/hess-19-3541-2015
Muhawenimana V, Follett E, Maddock I, Wilson CAME. 2023. Field-based monitoring of instream leaky barrier backwater and storage during storm events. Journal of Hydrology. 622:129744. https://doi.org/10.1016/j.jhydrol.2023.129744
Nash CS, Selker JS, Grant GE, Lewis SL, Noël P. 2018. A physical framework for evaluating net effects of wet meadow restoration on late‑summer streamflow. Ecohydrology. 11(5): e1953. https://doi.org/10.1002/eco.1953
Nash CS et al. 2021. Great Expectations: Deconstructing the process pathways underlying beaver-related restoration. BioScience. 71(3):249–267. https://doi.org/10.1093/biosci/biaa165
Nyssen J, Pontzeele J, Billi P. 2011. Effect of beaver dams on the hydrology of small mountain streams: Example from the Chevral in the Ourthe Orientale basin, Ardennes, Belgium. Journal of Hydrology. 402(1–2):92–102. https://doi.org/10.1016/j.jhydrol.2011.03.008
Pilliod DS et al. 2018. Survey of beaver-related restoration practices in rangeland streams of the Western USA. Environmental Management. 61(1):58–68. https://doi.org/10.1007/s00267-017-0957-6
Pitcairn M. 2023. Hydraulic modelling of Eurasian beaver structural modifications: implications for evaluating their contributions to natural flood management in Scotland [master’s thesis]. Lund (Sweden): Lund University. [accessed 2025 Jan 19]. https://lup.lub.lu.se/student-papers/search/publication/9123884
Pollock M et al. 2014. Using beaver dams to restore incised stream ecosystems. BioScience. 64(4):279–290. https://doi.org/10.1093/biosci/biu036
Pollock MM, Lewallen GM, Woodruff K, Jordan CE, Castro JM, editors. 2023. The beaver restoration guidebook: working with beaver to restore streams, wetlands, and floodplains. Version 2.02. Portland (OR): United States Fish and Wildlife Service. 189 p. https://www.fws.gov/media/beaver-restoration-guidebook
Pollock MM, Beechie TJ, Jordan CE. 2007. Geomorphic changes upstream of beaver dams in Bridge Creek, an incised stream channel in the interior Columbia River basin, eastern Oregon. Earth Surf Processes Landf. 32(8):1174–1185. https://doi.org/10.1002/esp.1553
Ronnquist AL, Westbrook CJ. 2021. Beaver dams: How structure, flow state, and landscape setting regulate water storage and release. Sci Total Environ. 785:147333. https://doi.org/10.1016/j.scitotenv.2021.147333
Sabeti R, Stamataki I, Kjeldsen TR. 2024. Reconstructing the 1968 River Chew flash flood: merging a HEC-RAS 2D hydraulic modelling approach with historical evidence. Geomatics, Natural Hazards and Risk. 15(1):2377655. https://doi.org/10.1080/19475705.2024.2377655
Scamardo J, Wohl E. 2020. Sediment storage and shallow groundwater response to beaver dam analogues in the Colorado Front Range, USA. River Research Apps. 36(3):398–409. https://doi.org/10.1002/rra.3592
Schultz K. 2025. Loss of beaver dams decreases floodplain connectivity in Colorado headwater streams [master’s thesis]. Fort Collins (CO): Colorado State University. https://mountainscholar.org/items/70908a19-010f-4b80-bf36-da2f0605da56
Senior JG, Trigg MA, Willis T. 2022. Physical representation of hillslope leaky barriers in 2D hydraulic models: A case study from the Calder Valley. J Flood Risk Management. 15(3):e12821. https://doi.org/10.1111/jfr3.12821
Stout TL, Majerova M, Neilson BT. 2017. Impacts of beaver dams on channel hydraulics and substrate characteristics in a mountain stream. Ecohydrology. 10(1):e1767. https://doi.org/10.1002/eco.1767
U.S. Geological Survey. 2019. The StreamStats program. [accessed 2025 Apr 5]. https://streamstats.usgs.gov/ss/
Weber N et al. 2017. Alteration of stream temperature by natural and artificial beaver dams Munderloh UG, editor. PLoS ONE. 12(5):e0176313. https://doi.org/10.1371/journal.pone.0176313
Wheaton J et al., editors. 2019. Low-tech process-based restoration of riverscapes - Design manual. Vol Version 1.0 Utah State University Restoration Consortium.
Whiley AJ, Merrill K. 2007. Newman Lake total phosphorus total maximum daily load: water quality improvement report. Olympia (WA): Washington State Department of Ecology, Water Quality Program. Publication No. 06-10-045. https://apps.ecology.wa.gov/publications/documents/0610045.pdf
Wohl E et al. 2016. Management of large wood in streams: an overview and proposed framework for hazard evaluation. J Am Water Resour Assoc. 52(2):315–335. https://doi.org/10.1111/1752-1688.12388
Wohl E, Rathburn SL, Dunn SB, Iskin E, Katz A, Marshall A, Means-Brous M, Scamardo J, Triantafillou S, Uno H. 2024. Geomorphic context in process-based river restoration. River Res Appl. 40(3):322-340. https://doi.org/10.1002/rra.4236
Wohl E, Scott DN, Yochum SE. 2019. Managing for large wood and beaver dams in stream corridors. U.S. Department of Agriculture, Forest Service, Rocky Mountain Research Station p RMRS-GTR-404. Report No.: RMRS-GTR-404. [accessed 2025 May 13]. https://doi.org/10.2737/RMRS-GTR-404
Yochum SE et al. 2014. Photographic guidance for selecting flow resistance coefficients in high-gradient channels. U.S. Department of Agriculture, Forest Service, Rocky Mountain Research Station p RMRS-GTR-323. Report No.: RMRS-GTR-323. [accessed 2025 May 8]. https://doi.org/10.2737/RMRS-GTR-323
Banner image courtesy of Ecometrics.